. 2025 Aug 7;26(15):7653.
doi: 10.3390/ijms26157653.

Aquaporins in the Capillaries of the Dura Mater of Pigs

Affiliations

Aquaporins in the Capillaries of the Dura Mater of Pigs

Slavica Martinović et al. Int J Mol Sci. .

Abstract

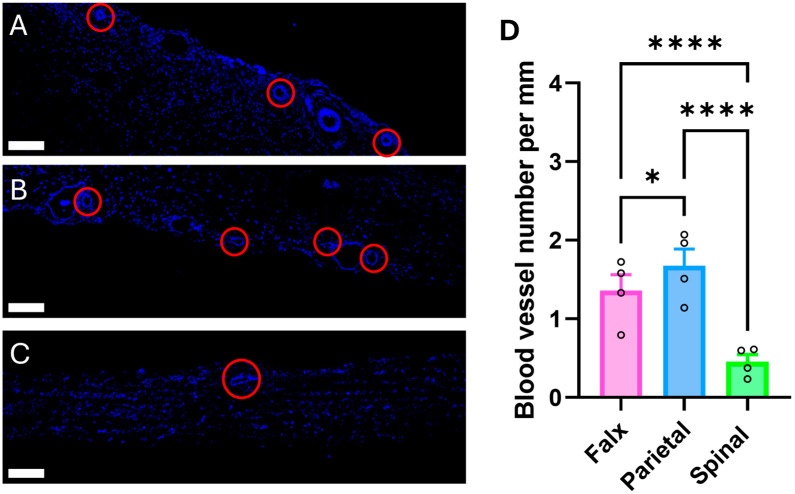
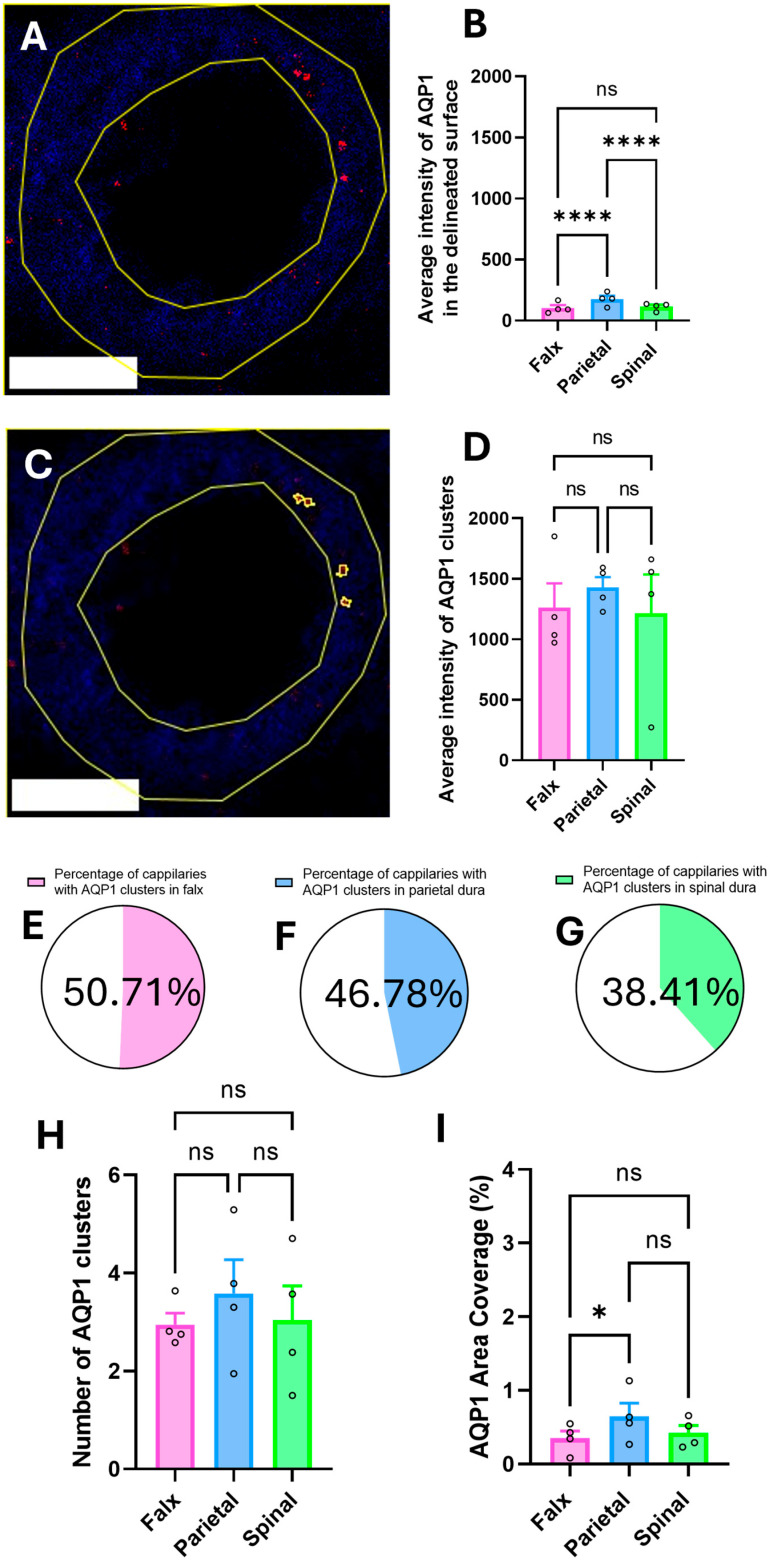
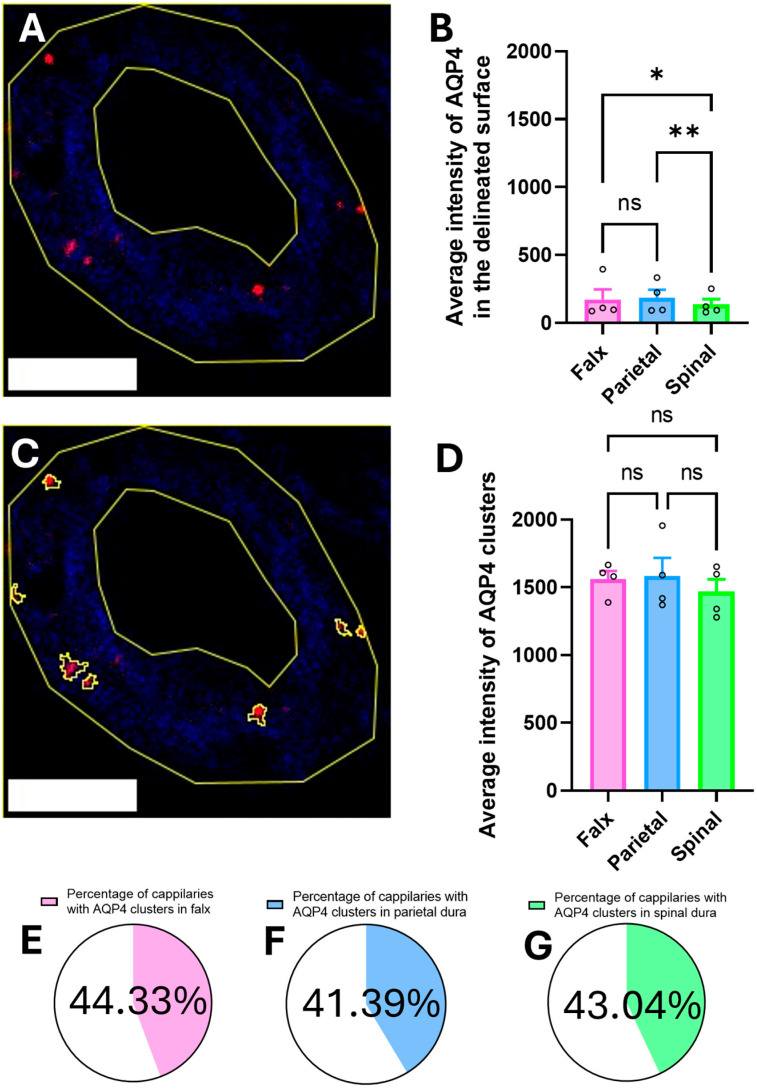
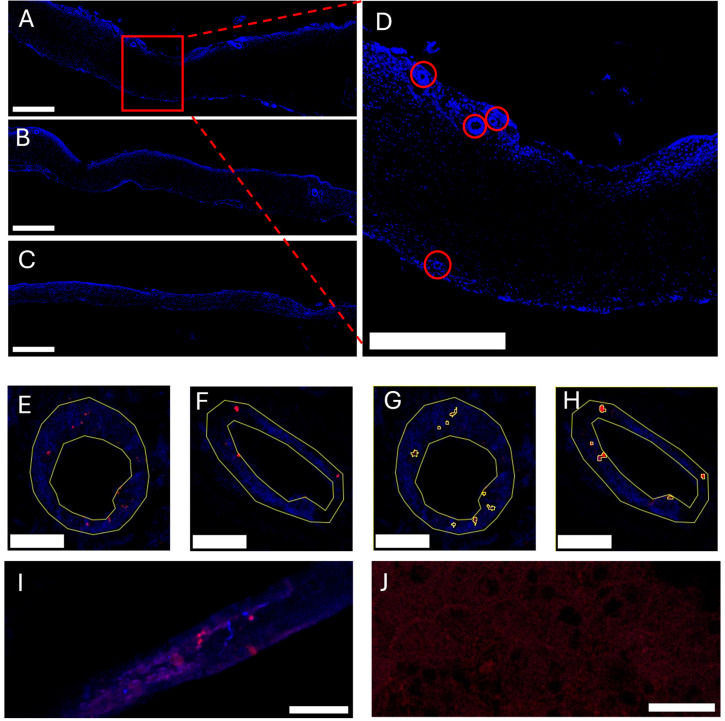
Dura mater plays a critical role in neurofluid homeostasis, yet comparative data on capillary network density and organization between cranial and spinal regions remain limited. This study addresses this gap by systematically analyzing capillary architecture and aquaporin (AQP) expression in porcine cranial (parietal, falx) and spinal dura mater. Immunofluorescence labeling and confocal microscopy were used to assess capillary density, spatial distribution, and AQP1/AQP4 expression patterns across over 1000 capillaries in these regions. Cranial dura exhibited a 3-4 times higher capillary density compared to spinal dura, with capillaries predominantly localized to meningeal-dural border cell interfaces in cranial regions and a more dispersed distribution in spinal dura. Both AQP1 and AQP4 were detected as discrete clusters within capillary walls, with higher expression in cranial compared to spinal dura. Lymphatic vessels (PDPN-positive) were also observed adjacent to capillaries, supporting a dual-system model for fluid and waste exchange. These findings highlight the dura's region-specific vascular specialization, with cranial regions favoring dense, structured capillary networks suited for active fluid exchange. This work establishes a foundation for investigating capillary-driven fluid dynamics in pathological states like subdural hematomas or hydrocephalus.

Keywords: Bulat–Klarica–Orešković hypothesis; aquaporin; capillary density; cerebrospinal fluid; cranial–spinal comparison; dura mater; lymphatic vessels; meningeal vascularization; porcine model.


Conflict of interest statement

The authors declare no conflicts of interest.

Figures

Figure 1
Figure 1
Distribution and quantification of CD31-positive blood vessels in distinct regions of the dura mater. (AC) Representative confocal images of the (A) falx cerebri, (B) parietal dura, and (C) spinal dura, immunolabeled for CD31 (blue). Capillaries (diameter < 20 µm) are indicated by red circles. All images acquired at 10× objective; scale bars, 500 µm. (D) Quantification of capillary density, expressed as the mean number of capillaries per mm of dura mater in each region (mean ± SEM). Capillary density is significantly higher in the parietal dura (1.67 ± 0.21 vessels/mm) compared to the falx cerebri (1.36 ± 0.20 vessels/mm) and spinal dura (0.45 ± 0.09 vessels/mm). Statistical significance determined by two-way ANOVA with post hoc testing (* p < 0.05, **** p < 0.0001).
Figure 2
Figure 2
Regional distribution and intensity of AQP1 signal within delineated surface (capillary walls) of the dura mater. (A) Representative confocal image of a capillary immunolabeled for CD31 (blue), with the endothelial cytoplasmic surface area outlined by the outer and inner vessel boundaries delineated (capillary wall) (yellow). AQP1 immunoreactivity (red) is visible within the capillary wall; 20× objective, scale bar 20 μm. (B) Quantification of average intensity of AQP1 in the delineated surface across regions. AQP1 intensity is significantly higher in the parietal dura (177.4 ± 27.04) compared to the falx (104.7 ± 22.11) and spinal dura (114.9 ± 15.82), with no significant difference between the latter two regions (**** p < 0.0001, ns). (C) 20× objective image of the capillary shown in (A), highlighting AQP1-positive clusters (circled in yellow) within the capillary wall. Scale bar 20 μm. (D) Quantification of average AQP1 cluster intensity reveals no significant regional differences between the falx (1394 ± 205.3), parietal dura (1428 ± 85.78), and spinal dura (1549 ± 414.5) (ns). (EG) Proportion of analyzed capillaries exhibiting AQP1 clusters in the falx (50.71%), parietal dura (46.78%), and spinal dura (38.41%), respectively, indicating regional variability in the presence of AQP1 clustering. (H) Average number of AQP1 clusters per capillary (where clusters were detected) does not differ significantly between regions: falx (2.95 ± 0.24), parietal dura (3.58 ± 0.69), and spinal dura (3.04 ± 0.70) (ns). (I) AQP1 area coverage (%) in each region. The parietal dura exhibits a significantly higher proportion of AQP1-positive wall area (0.65 ± 0.18%) compared to the falx (0.35 ± 0.10%, * p < 0.05), while the spinal dura (0.10 ± 0.2%) shows no significant difference relative to other regions. Statistical significance was determined by one-way ANOVA with Tukey’s post hoc test.
Figure 3
Figure 3
Regional distribution and intensity of AQP4 signal within delineated surface (capillary walls) of the dura mater. (A) Representative confocal image of a capillary immunolabeled for CD31 (blue), with the endothelial cytoplasmic surface area outlined by the outer and inner vessel boundaries delineated (capillary wall) (yellow). AQP4 immunoreactivity (red) is visible within the capillary wall. Scale bar 20 μm. (B) Quantification of average intensity of AQP4 in the delineated surface across regions. AQP4 intensity is significantly higher in the parietal dura (176.2 ± 46.01) compared to the spinal dura (135.8 ± 30.40, ** p < 0.01) and between falx (166.7 ± 57.87) and spinal dura (* p < 0.05), with no significant difference between falx and parietal regions (ns). (C) Image of the capillary shown in (A), highlighting AQP4-positive clusters (circled in yellow) within the capillary wall. (D) Quantification of average AQP4 cluster fluorescence intensity reveals no significant regional differences between the falx (1593 ± 56.19), parietal dura (1574 ± 103.1), and spinal dura (1453 ± 73.12) (ns). (EG) Proportion of analyzed capillaries exhibiting AQP4 clusters in the falx (44.33%), parietal dura (41.39%), and spinal dura (43.04%), respectively. (H) Average number of AQP4 clusters per capillary (where clusters were detected) does not differ significantly between regions: falx (3.02 ± 0.86), parietal dura (3.35 ± 0.93), and spinal dura (2.74 ± 0.55) (ns). (I) AQP4 area coverage (%) in each region. The parietal dura exhibits a significantly higher proportion of AQP4-positive wall area (1.33 ± 0.57%) compared to the spinal dura (0.57 ± 0.20%, * p < 0.05), while no significant differences were observed between falx (0.83 ± 0.45%) and other regions. Data are presented as means ± SEM. Statistical significance was determined by one-way ANOVA with Tukey’s post hoc test.
Figure 3
Figure 3
Regional distribution and intensity of AQP4 signal within delineated surface (capillary walls) of the dura mater. (A) Representative confocal image of a capillary immunolabeled for CD31 (blue), with the endothelial cytoplasmic surface area outlined by the outer and inner vessel boundaries delineated (capillary wall) (yellow). AQP4 immunoreactivity (red) is visible within the capillary wall. Scale bar 20 μm. (B) Quantification of average intensity of AQP4 in the delineated surface across regions. AQP4 intensity is significantly higher in the parietal dura (176.2 ± 46.01) compared to the spinal dura (135.8 ± 30.40, ** p < 0.01) and between falx (166.7 ± 57.87) and spinal dura (* p < 0.05), with no significant difference between falx and parietal regions (ns). (C) Image of the capillary shown in (A), highlighting AQP4-positive clusters (circled in yellow) within the capillary wall. (D) Quantification of average AQP4 cluster fluorescence intensity reveals no significant regional differences between the falx (1593 ± 56.19), parietal dura (1574 ± 103.1), and spinal dura (1453 ± 73.12) (ns). (EG) Proportion of analyzed capillaries exhibiting AQP4 clusters in the falx (44.33%), parietal dura (41.39%), and spinal dura (43.04%), respectively. (H) Average number of AQP4 clusters per capillary (where clusters were detected) does not differ significantly between regions: falx (3.02 ± 0.86), parietal dura (3.35 ± 0.93), and spinal dura (2.74 ± 0.55) (ns). (I) AQP4 area coverage (%) in each region. The parietal dura exhibits a significantly higher proportion of AQP4-positive wall area (1.33 ± 0.57%) compared to the spinal dura (0.57 ± 0.20%, * p < 0.05), while no significant differences were observed between falx (0.83 ± 0.45%) and other regions. Data are presented as means ± SEM. Statistical significance was determined by one-way ANOVA with Tukey’s post hoc test.
Figure 4
Figure 4
Comparative analysis of AQP1 and AQP4 distribution patterns across dural regions. Direct comparisons between AQP1 (pink/blue/light green bars) and AQP4 (purple/dark blue/green bars) within each anatomical region for multiple parameters. (A) Average intensity of AQP signal in the delineated capillary wall surface shows no significant differences between AQP1 and AQP4 in any region. (B) Average intensity of AQP clusters reveals no significant differences between the two aquaporins across all regions. (C) Percentage of vessels containing AQP clusters shows similar distribution patterns for both AQP1 and AQP4. (D) Number of AQP clusters per capillary demonstrates no significant differences between aquaporins in any region. (E) AQP area coverage (%) shows comparable proportions of capillary wall area occupied by AQP1 and AQP4 across all regions. Data presented as mean ± SEM. Statistical significance was determined by unpaired t-test for each regional comparison. ns = not significant (p > 0.05). Falx = falx cerebri; Parietal = parietal dura; Spinal = spinal dura.
Figure 5
Figure 5
Immunofluorescence characterization of vascular and lymphatic structures in porcine dura mater. Confocal microscopy images showing podoplanin (PDPN, green) and CD31 (blue) double immunolabeling demonstrating the relationship between capillaries and lymphatic vessels across different dural regions. (A) Spinal dura mater imaged with 5× digital zoom. (B) Falx cerebri imaged without digital zoom, showing a larger vessel. (C) Parietal dura mater imaged with 5× digital zoom. The differential expression pattern confirms that the analyzed capillary structures are blood vessels (CD31-positive, PDPN-negative) rather than lymphatic vessels (PDPN-positive). Scale bar = 20 μm for all panels.
Figure 6
Figure 6
Confocal microscopy images of dura mater cross-sections demonstrating capillary architecture as noted by CD31 antibody reactivity (blue) and aquaporin expression (red). (A) Falx cerebri (cranial dura mater) at 10× objective. (B) Parietal dura mater. (C) Spinal dura mater. All images acquired at 10× objective; scale bars, 500 µm. (D) Higher magnification of the cranial dura (region indicated in (A)—red square), highlighting capillaries (circled in red). Scale bar = 100 µm. (E) Transverse section of a capillary with delineated outer and inner vessel walls (yellow), showing aquaporin 1 (AQP1) immunoreactivity within the vessel wall (red). Scale bar = 20 µm, objective 20×. (F) Transverse section of a capillary with delineated vessel walls (yellow), showing aquaporin 4 (AQP4) immunoreactivity (red). Scale bar = 20 µm. (G) Detail of the capillary shown in (E) with discrete AQP1-positive clusters annotated (yellow regions of interest (ROI-s) inside the delineated surface (capillary wall)). Scale bar = 20 µm. (H) Detail of the capillary shown in (F) with discrete AQP4-positive clusters annotated. Scale bar = 20 µm. (I) Positive control for AQP1 and CD31 immunoreactivity in kidney tissue, demonstrating specific AQP1 expression (red) and CD31 labeling (blue) in glomerular and peritubular capillaries. Scale bar = 20 µm. (J) Negative control for AQP1 and CD31 immunoreactivity in liver tissue, showing absence of specific signal, confirming antibody specificity. Scale bar = 20 µm.

Similar articles

References

    1. Ghannam J.Y., Al Kharazi K.A. StatPearls. StatPearls Publishing; Treasure Island, FL USA: 2024. Neuroanatomy, Cranial Meninges. - PubMed
    1. Adeeb N., Mortazavi M.M., Tubbs R.S., Cohen-Gadol A.A. The Cranial Dura Mater: A Review of Its History, Embryology, and Anatomy. Childs Nerv. Syst. 2012;28:827–837. doi: 10.1007/s00381-012-1744-6. - DOI - PubMed
    1. Hammady M. Histology of the Human Dura Mater; A Review Article. Egypt. J. Vet. Sci. 2023;54:907–916. doi: 10.21608/ejvs.2023.207485.1496. - DOI
    1. Protasoni M., Sangiorgi S., Cividini A., Culuvaris G.T., Tomei G., Dell’Orbo C., Raspanti M., Balbi S., Reguzzoni M. The Collagenic Architecture of Human Dura Mater: Laboratory Investigation. J. Neurosurg. 2011;114:1723–1730. doi: 10.3171/2010.12.JNS101732. - DOI - PubMed
    1. Morales-Avalos R., Soto-Domínguez A., García-Juárez J., Saucedo-Cardenas O., Bonilla-Galvan J.R., Cardenas-Serna M., Guzmán-López S., Elizondo-Omaña R.E. Characterization and Morphological Comparison of Human Dura Mater, Temporalis Fascia, and Pericranium for the Correct Selection of an Autograft in Duraplasty Procedures. Surg. Radiol. Anat. 2017;39:29–38. doi: 10.1007/s00276-016-1692-z. - DOI - PubMed

LinkOut - more resources