. 2025 Aug 7;26(15):7658.
doi: 10.3390/ijms26157658.

Combining Time-Restricted Wheel Running and Feeding During the Light Phase Increases Running Intensity Under High-Fat Diet Conditions Without Altering the Total Amount of Daily Running

Affiliations

Combining Time-Restricted Wheel Running and Feeding During the Light Phase Increases Running Intensity Under High-Fat Diet Conditions Without Altering the Total Amount of Daily Running

Ayano Shiba et al. Int J Mol Sci. .

Abstract

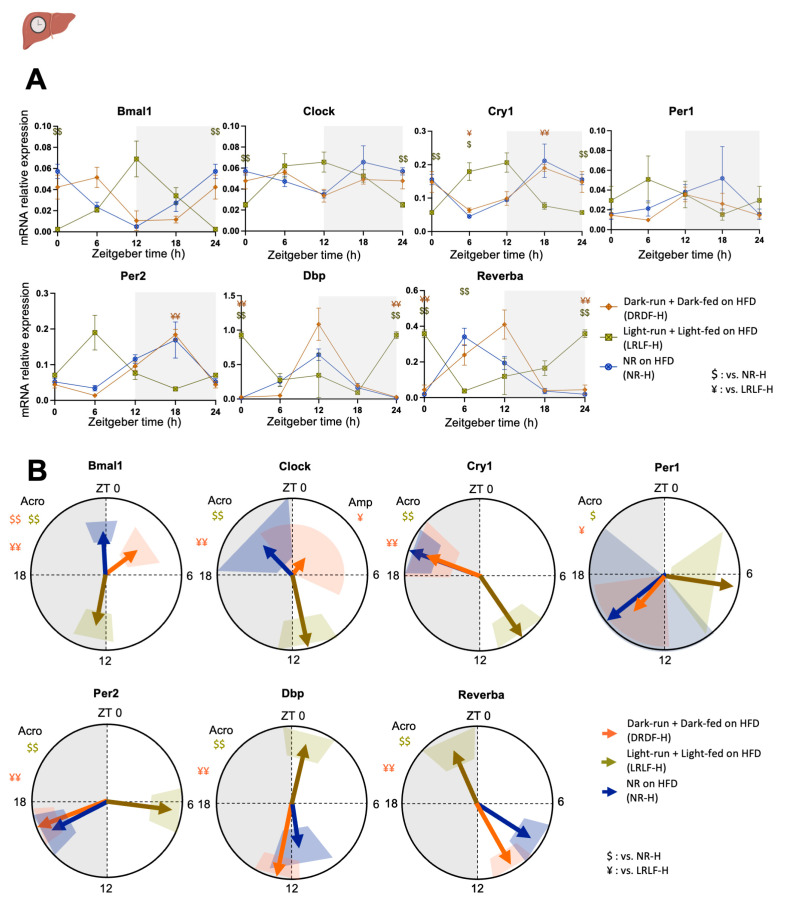
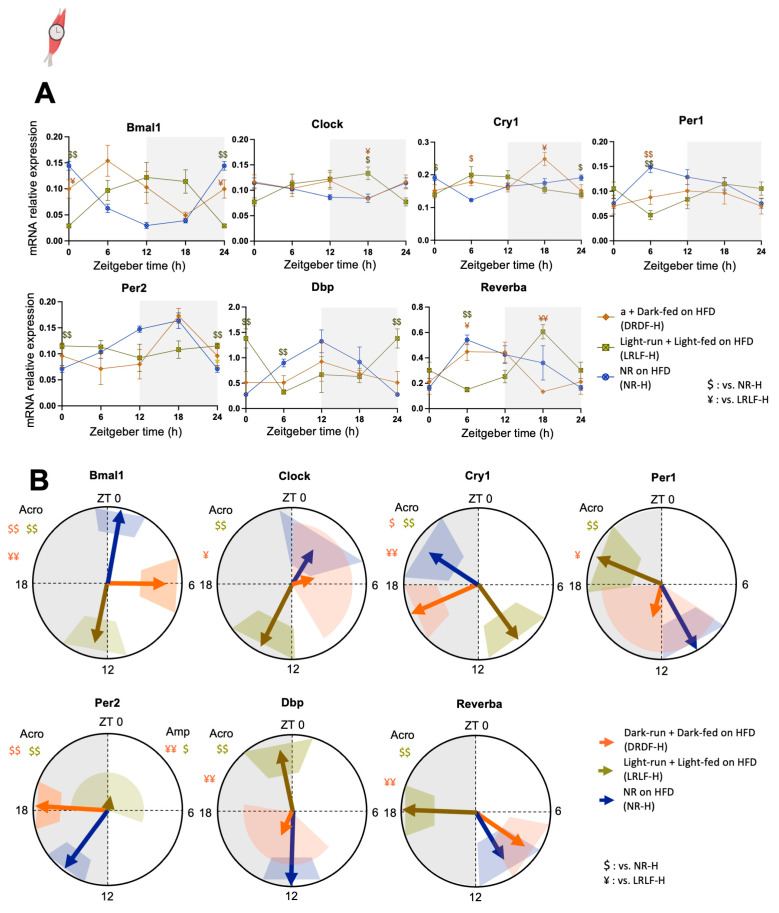
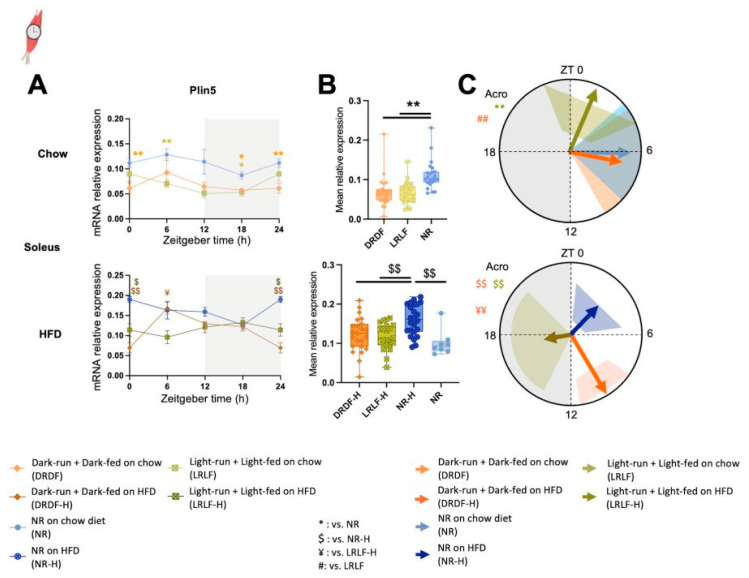
Excess caloric intake and insufficient physical activity are the two major drivers underlying the global obesity and type 2 diabetes mellitus epidemics. However, circadian misalignment of caloric intake and physical activity, as commonly experienced by nightshift workers, can also have detrimental effects on body weight and glucose homeostasis. We have previously reported that combined restriction of eating and voluntary wheel running to the inactive phase (i.e., a rat model for circadian misalignment) shifted liver and muscle clock rhythms by ~12 h and prevented the reduction in the amplitude of the muscle clock oscillation otherwise induced by light-phase feeding. Here, we extended on these findings and investigated how a high-fat diet (HFD) affects body composition and liver and muscle clock gene rhythms in male Wistar rats while restricting both eating and exercise to either the inactive or active phase. To do this, we used four experimental conditions: sedentary controls with no wheel access on a non-obesogenic diet (NR), sedentary controls with no wheel access on an HFD (NR-H), and two experimental groups on an HFD with simultaneous access to a running wheel and HFD time-restricted to either the light phase (light-run-light-fed + HFD, LRLF-H) or the dark phase (dark-run-dark-fed + HFD. DRDF-H). Consumption of an HFD did not alter the daily running distance of the time-restricted groups but did increase the running intensity in the LRLF-H group compared to a previously published LRLF chow fed group. However, no such increase was observed for the DRDF-H group. LRLF-H ameliorated light phase-induced disturbances in the soleus clock more effectively than under chow conditions and had a protective effect against HFD-induced changes in liver clock gene expression. Together with (our) previously published results, these data suggest that eating healthy and being active at the wrong time of the day can be as detrimental as eating unhealthy and being active at the right time of the day.

Keywords: circadian misalignment; high fat diet; liver; muscle; plin5; time restricted feeding; time restricted running.


Conflict of interest statement

The authors have no conflict of interest.

Figures

Figure 1
Figure 1
Under high-fat diet (HFD) conditions combining time-restricted wheel running and time-restricted feeding in the light phase has less beneficial metabolic outcomes than combining running and feeding in the dark phase. (A): The average daily running distance of each group per animal during the experiment. (B): Body weight growth. (C): Gain of body weight from the start of the time restriction. (D): Fat mass in percentage of body weight. (E): Gain of body fat from the start of the time-restricted running period. (F): Caloric intake during the time restriction period. (G,H): Daily running pattern during the baseline (G) and time restriction (H). Dark running dark-fed group on high fat diet (DRDF-H, in orange with brown frame): n = 24, Light running light-fed group on high fat diet (LRLF-H, in yellow green with olive frame): n = 24, Sedentary non-runner on high fat diet (NR-H, blue with dark blue frame): n = 24, Sedentary non-runner on chow diet (NR, light blue with blue frame): n = 8. Data are presented as the mean ± SEM. Significant difference from NR (*), from NR-H ($), or from LRLF-H (¥) compared to the groups of color code. * or $ or ¥: p < 0.05, ** or $$ or ¥¥: p < 0.01 by one-way ANOVA or mixed-effects analysis followed by Tukey’s HSD post hoc test. TR: time restriction.
Figure 2
Figure 2
Four weeks of combined running and feeding during the light phase alters the expression profiles of clock genes in rat liver. (A): mRNA relative expression analyzed by two-way ANOVA followed by Tukey HSD post hoc test. (B): Acrophase (indicated by the direction of arrows) with their amplitude (indicated by the length of arrows) of the clock (controlled) genes were analysed by cosinor-based rhythmometry analysis using CosinorPy. CosinorPy adjusts the significance values using the false discovery rate (FDR) method (reported as q-values). Signs in the right top corner of each circular figure represent significant differences in amplitude. Signs in the left top corner of each circular figure represent significant differences in acrophase. Grey shaded area represents the dark (inactive) phase. Coloured shaded areas (corresponding to the group colour code) in B represent 95% confidence interval. ZT = Zeitgeber time, h = hour (time). Amp: Amplitude. Acro: Acrophase. Data are presented as the mean ± SEM. Significant difference from NR-H ($), or from LRLF-H (¥) compared to the groups of color code. $ or ¥: p < 0.05, $$ or ¥¥: p < 0.01 by one-way ANOVA or mixed-effects analysis followed by Tukey HSD post hoc test. Icon created with BioRender.com.
Figure 3
Figure 3
Four weeks of combined running and feeding during the light phase alters the expression profiles of clock genes in rat soleus. (A): mRNA relative expression analyzed by two-way ANOVA followed by Tukey HSD post hoc test. (B): Acrophase (indicated by the direction of arrows) with their amplitude (indicated by the length orestriction period did not differ (Figure S1I). No such differences in running activity were observed between the DRDF-H and DRDF groups. The hepatic clock gene expression patterns of the time-restricted HFD groups were similar to those of our previous time-f arrows) of the clock (controlled) genes were analysed by cosinor-based rhythmometry analysis using CosinorPy. CosinorPy adjusts the significance values using the false discovery rate (FDR) method (reported as q-values). Signs in the right top corner of each circular figure represent significant differences in amplitude. Signs in the left top corner of each circular figure represent significant differences in acrophase. Grey shaded area represents the dark (inactive) phase. Coloured shaded areas (corresponding to the group colour code) in B represent 95% confidence interval. ZT = Zeitgeber time, h = hour (time). Amp: Amplitude. Acro: Acrophase. Data are presented as the mean ± SEM. Significant difference from NR-H ($), or from LRLF-H (¥) compared to the groups of color code. $ or ¥: p < 0.05, $$ or ¥¥: p < 0.01 by one-way ANOVA or mixed-effects analysis followed by Tukey’s HSD post hoc test. Icon created with BioRender.com.
Figure 4
Figure 4
Both high-fat diet (HFD) and four weeks of combined running and feeding alters the expression levels and profiles of Plin5 gene in rat soleus muscle. (A): mRNA relative expression analyzed by two-way ANOVA followed by Tukey HSD post hoc test. (B): Mean Plin5 expression in soleus muscle under both chow (top) and high fat diet condition (HFD, bottom). (C): Acrophase (indicated by the direction of arrows) with their amplitude (indicated by the length of arrows) of the clock (controlled) genes were analysed by cosinor-based rhythmometry analysis using CosinorPy (top: chow, bottom: HFD). CosinorPy adjusts the significance values using the false discovery rate (FDR) method (reported as q-values). Signs in the right top corner of each circular figure represent significant differences in amplitude. Signs in the left top corner of each circular figure represent significant differences in acrophase. Grey shaded area represents the dark (inactive) phase. Coloured shaded areas (corresponding to the group colour code) in B represent 95% confidence interval. ZT= Zeitgeber time, h= hour (time). Amp: Amplitude. Acro: Acrophase. Chow; At ZT0 (NR, n = 6; DRDF, n = 6; LRLF, n = 6), at ZT6 (NR, n = 6; DRDF, n = 6; LRLF, n = 6), at ZT12 (NR, n = 6; DRDF, n = 6; LRLF, n = 6), and at ZT18 (NR, n = 6; DRDF, n = 6; LRLF, n = 6). Data are presented as the mean ± SEM. Significant difference from NR (*), from NR-H ($), or from LRLF-H (¥), or from LRLF, compared to the groups of color code. * or $ or ¥ or #: p < 0.05, ** or $$ or ¥¥ or ##: p < 0.01 by one-way ANOVA or mixed-effects analysis followed by Tukey’s HSD post hoc test. Icon created with BioRender.com.
Figure 5
Figure 5
Summary of the current findings on the impact of HFD and the combination of time-restricted running and time-restricted feeding.

Similar articles

References

    1. Morris C.J., Purvis T.E., Mistretta J., Scheer F.A.J.L. Effects of the Internal Circadian System and Circadian Misalignment on Glucose Tolerance in Chronic Shift Workers. J. Clin. Endocrinol. Metab. 2016;101:1066–1074. doi: 10.1210/jc.2015-3924. - DOI - PMC - PubMed
    1. de Goede P., Foppen E., Ritsema W.I.G.R., Korpel N.L., Yi C.-X., Kalsbeek A. Time-Restricted Feeding Improves Glucose Tolerance in Rats, but Only When in Line with the Circadian Timing System. Front. Endocrinol. 2019;10:554. doi: 10.3389/fendo.2019.00554. - DOI - PMC - PubMed
    1. Joo J., Cox C.C., Kindred E.D., Lashinger L.M., Young M.E., Bray M.S. The acute effects of time-of-day-dependent high fat feeding on whole body metabolic flexibility in mice. Int. J. Obes. 2016;40:1444–1451. doi: 10.1038/ijo.2016.80. - DOI - PMC - PubMed
    1. Clemmensen C., Müller T.D., Woods S.C., Berthoud H.-R., Seeley R.J., Tschöp M.H. Gut-Brain Cross-Talk in Metabolic Control. Cell. 2017;168:758–774. doi: 10.1016/j.cell.2017.01.025. - DOI - PMC - PubMed
    1. Mendoza J., Pévet P., Challet E. High-fat feeding alters the clock synchronization to light. J. Physiol. 2008;586:5901–5910. doi: 10.1113/jphysiol.2008.159566. - DOI - PMC - PubMed

LinkOut - more resources