Validation of Hemoglobin and Hematocrit Measurements from a Dialysis Machine Sensor Compared to Laboratory Analysis
- PMID: 40806864
- PMCID: PMC12346908
- DOI: 10.3390/jcm14155242
Validation of Hemoglobin and Hematocrit Measurements from a Dialysis Machine Sensor Compared to Laboratory Analysis
Abstract
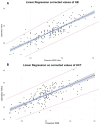
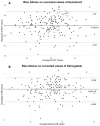
Background: Continuous monitoring of hemoglobin (HB) and hematocrit (HCT) during hemodialysis could improve fluid management and patient safety. The Fresenius 5008 dialysis machine includes an ultrasound-based sensor that estimates HB and HCT values, though its accuracy compared to standard laboratory measurements remains unclear. Methods: This exploratory observational study assessed the agreement between sensor-derived and laboratory-derived HB and HCT values in 20 patients at the start of hemodiafiltration. A total of 177 paired blood samples were collected. Results: Sensor values significantly underestimated laboratory HB (9.61 vs. 11.31 g/dL) and HCT (27% vs. 34%) (p < 8 × 10-25). Correlations were strong for both parameters (HB: r = 0.788; HCT: r = 0.876). Regression analyses revealed consistent proportional bias. Applying a fixed correction of +1.69 g/dL for HB and +7.55% for HCT eliminated the statistical differences and reduced intercepts in regression models. Bland-Altman plots confirmed improved agreement post-correction. Albumin levels correlated modestly with error magnitude. Conclusions: HB and HCT values from the Fresenius 5008 sensor are strongly correlated with laboratory data but are systematically underestimated at treatment start, likely due to hemodilution. Applying fixed correction factors improves accuracy and supports the sensor's use for real-time monitoring.
Keywords: blood volume monitoring; hematocrit; hemodialysis; hemoglobin; sensor validation.
Conflict of interest statement
The authors declare no conflicts of interest.
Figures


Similar articles
-
Dual- energy CT versus single-energy CT for estimation of hematocrit and hemoglobin in the brain: an in vivo analysis.Neuroradiology. 2025 Jul 14. doi: 10.1007/s00234-025-03700-3. Online ahead of print. Neuroradiology. 2025. PMID: 40658143
-
Haemoglobin and haematocrit targets for the anaemia of chronic renal disease.Cochrane Database Syst Rev. 2003;(1):CD003967. doi: 10.1002/14651858.CD003967. Cochrane Database Syst Rev. 2003. Update in: Cochrane Database Syst Rev. 2006 Oct 18;(4):CD003967. doi: 10.1002/14651858.CD003967.pub2. PMID: 12535495 Updated.
-
Prescription of Controlled Substances: Benefits and Risks.2025 Jul 6. In: StatPearls [Internet]. Treasure Island (FL): StatPearls Publishing; 2025 Jan–. 2025 Jul 6. In: StatPearls [Internet]. Treasure Island (FL): StatPearls Publishing; 2025 Jan–. PMID: 30726003 Free Books & Documents.
-
Comparison of Two Modern Survival Prediction Tools, SORG-MLA and METSSS, in Patients With Symptomatic Long-bone Metastases Who Underwent Local Treatment With Surgery Followed by Radiotherapy and With Radiotherapy Alone.Clin Orthop Relat Res. 2024 Dec 1;482(12):2193-2208. doi: 10.1097/CORR.0000000000003185. Epub 2024 Jul 23. Clin Orthop Relat Res. 2024. PMID: 39051924
-
Effect and safety of intravenous iron compared to oral iron for treatment of iron deficiency anaemia in pregnancy.Cochrane Database Syst Rev. 2024 Dec 9;12(12):CD016136. doi: 10.1002/14651858.CD016136. Cochrane Database Syst Rev. 2024. PMID: 39651609
References
-
- Mann H., Stiller S., Schallenberg U., Thömmes A. Optimizing Dialysis by Variation of Ultrafiltration Rate and Sodium Concentration Controlled by Continuous Measurement of Circulating Blood Volume. In: Baldamus C.A., Mion C., Shaldon S., editors. Contributions to Nephrology. S. Karger AG; Basel, Switzerland: 1990. pp. 182–190. - PubMed
-
- Leung K.C.W., Quinn R.R., Ravani P., Duff H., MacRae J.M. Randomized Crossover Trial of Blood Volume Monitoring–Guided Ultrafiltration Biofeedback to Reduce Intradialytic Hypotensive Episodes with Hemodialysis. Clin. J. Am. Soc. Nephrol. 2017;12:1831–1840. doi: 10.2215/CJN.01030117. - DOI - PMC - PubMed
LinkOut - more resources
Full Text Sources

