

Analyzing Heart Rate Variability for COVID-19 ICU Mortality Prediction Using Continuous Signal Processing Techniques
- PMID: 40806933
- PMCID: PMC12347825
- DOI: 10.3390/jcm14155312
Analyzing Heart Rate Variability for COVID-19 ICU Mortality Prediction Using Continuous Signal Processing Techniques
Abstract
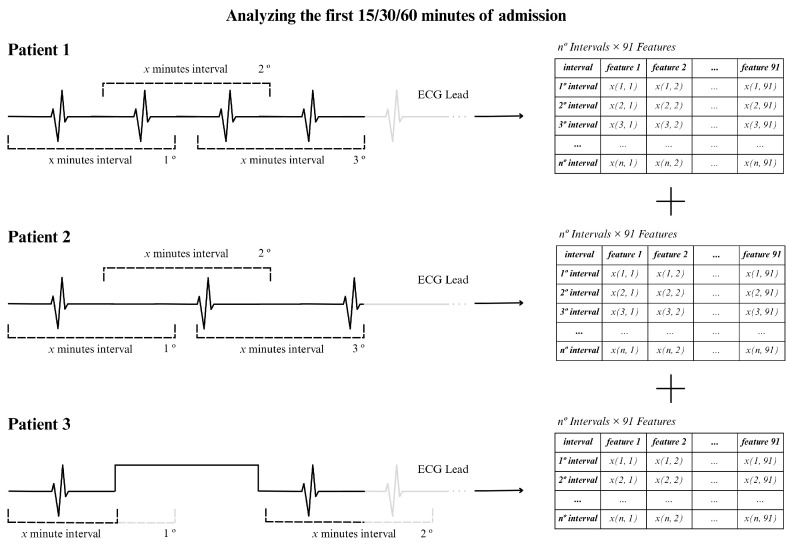
Background/Objectives: Heart rate variability (HRV) has been widely investigated as a predictor of disease and mortality across diverse patient populations; however, there remains no consensus on the optimal set or combination of time and frequency domain nor on nonlinear features for reliable prediction across clinical contexts. Given the relevance of the COVID-19 pandemic and the unique clinical profiles of these patients, this retrospective observational study explored the potential of HRV analysis for early prediction of in-hospital mortality using ECG signals recorded during the initial moments of ICU admission in COVID-19 patients. Methods: HRV indices were extracted from four ECG leads (I, II, III, and aVF) using sliding windows of 2, 5, and 7 min across observation intervals of 15, 30, and 60 min. The raw data posed significant challenges in terms of structure, synchronization, and signal quality; thus, from an original set of 381 records from 321 patients, after data pre-processing steps, a final dataset of 82 patients was selected for analysis. To manage data complexity and evaluate predictive performance, two feature selection methods, four feature reduction techniques, and five classification models were applied to identify the optimal approach. Results: Among the feature aggregation methods, compiling feature means across patient windows (Method D) yielded the best results, particularly for longer observation intervals (e.g., using LDA, the best AUC of 0.82±0.13 was obtained with Method D versus 0.63±0.09 with Method C using 5 min windows). Linear Discriminant Analysis (LDA) was the most consistent classification algorithm, demonstrating robust performance across various time windows and further improvement with dimensionality reduction. Although Gradient Boosting and Random Forest also achieved high AUCs and F1-scores, their performance outcomes varied across time intervals. Conclusions: These findings support the feasibility and clinical relevance of using short-term HRV as a noninvasive, data-driven tool for early risk stratification in critical care, potentially guiding timely therapeutic decisions in high-risk ICU patients and thereby reducing in-hospital mortality.
Keywords: COVID-19; HRV; ICU; mortality.
Conflict of interest statement
The authors declare no competing interests.
Figures


References
-
- Agabiti-Rosei E. Antiadrenergic Agents. In: Huhtaniemi I., Martini L., editors. Encyclopedia of Endocrine Diseases. 2nd ed. Academic Press; Oxford, UK: 2019. pp. 443–448. - DOI
-
- Jarczok M.N., Weimer K., Braun C., Williams D.P., Thayer J.F., Gündel H.O., Balint E.M. Heart rate variability in the prediction of mortality: A systematic review and meta-analysis of healthy and patient populations. Neurosci. Biobehav. Rev. 2022;143:104907. doi: 10.1016/j.neubiorev.2022.104907. - DOI - PubMed
Grants and funding
LinkOut - more resources
Full Text Sources
