

Integrating CT-Based Lung Fibrosis and MRI-Derived Right Ventricular Function for the Detection of Pulmonary Hypertension in Interstitial Lung Disease
- PMID: 40806951
- PMCID: PMC12347256
- DOI: 10.3390/jcm14155329
Integrating CT-Based Lung Fibrosis and MRI-Derived Right Ventricular Function for the Detection of Pulmonary Hypertension in Interstitial Lung Disease
Abstract
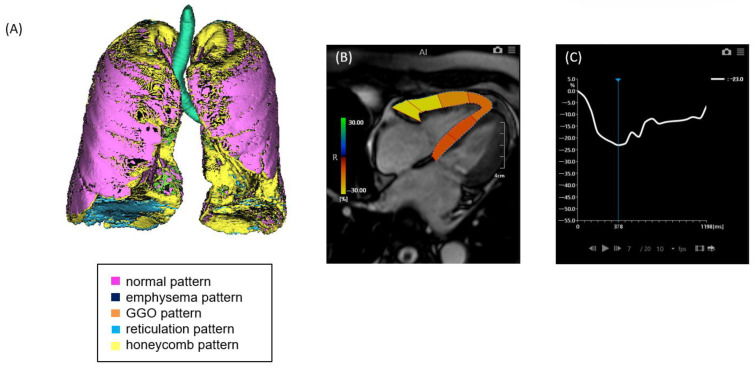
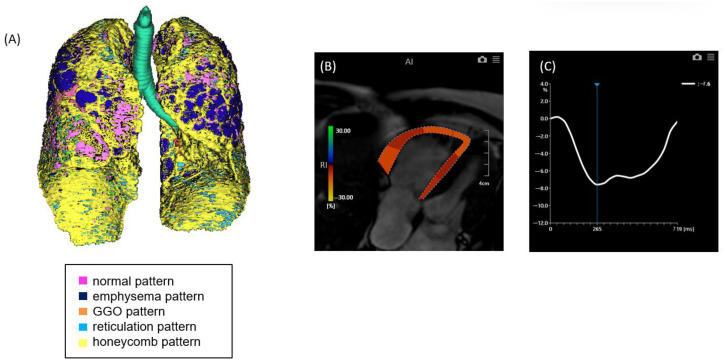
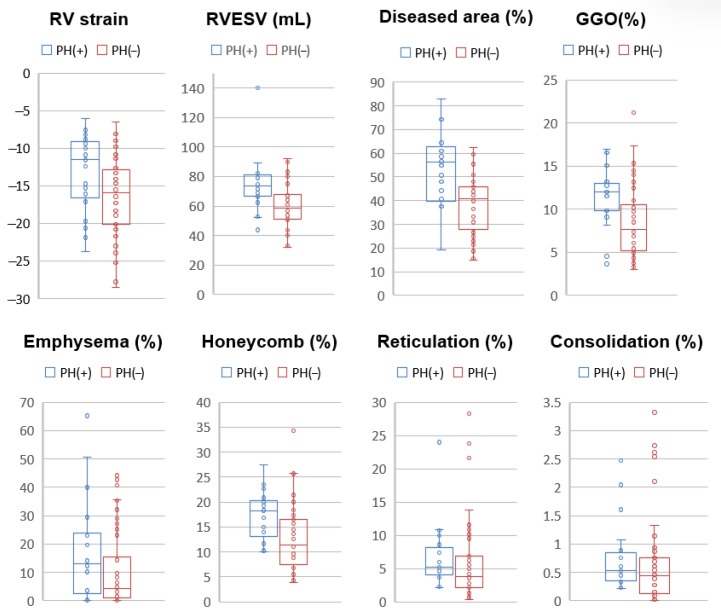
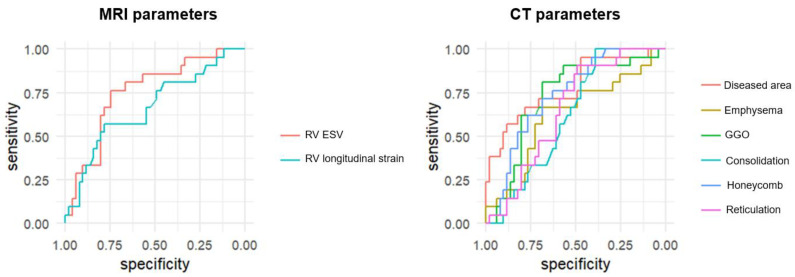
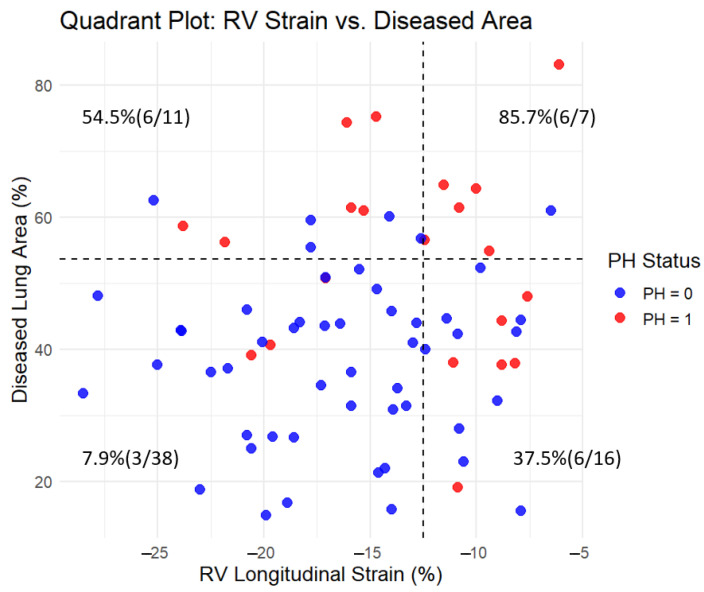
Background/Objectives: Interstitial lung disease (ILD) is frequently complicated by pulmonary hypertension (PH), which is associated with reduced exercise capacity and poor prognosis. Early and accurate non-invasive detection of PH remains a clinical challenge. This study evaluated whether combining quantitative CT analysis of lung fibrosis with cardiac MRI-derived measures of right ventricular (RV) function improves the diagnostic accuracy of PH in patients with ILD. Methods: We retrospectively analyzed 72 ILD patients who underwent chest CT, cardiac MRI, and right heart catheterization (RHC). Lung fibrosis was quantified using a Gaussian Histogram Normalized Correlation (GHNC) software that computed the proportions of diseased lung, ground-glass opacity (GGO), honeycombing, reticulation, consolidation, and emphysema. MRI was used to assess RV end-systolic volume (RVESV), ejection fraction, and RV longitudinal strain. PH was defined as a mean pulmonary arterial pressure (mPAP) ≥ 20 mmHg and pulmonary vascular resistance ≥ 3 Wood units on RHC. Results: Compared to patients without PH, those with PH (n = 21) showed significantly reduced RV strain (-13.4 ± 5.1% vs. -16.4 ± 5.2%, p = 0.026) and elevated RVESV (74.2 ± 18.3 mL vs. 59.5 ± 14.2 mL, p = 0.003). CT-derived indices also differed significantly: diseased lung area (56.4 ± 17.2% vs. 38.4 ± 12.5%, p < 0.001), GGO (11.8 ± 3.6% vs. 8.65 ± 4.3%, p = 0.005), and honeycombing (17.7 ± 4.9% vs. 12.8 ± 6.4%, p = 0.0027) were all more prominent in the PH group. In receiver operating characteristic curve analysis, diseased lung area demonstrated an area under the curve of 0.778 for detecting PH. This increased to 0.847 with the addition of RVESV, and further to 0.854 when RV strain was included. Combined models showed significant improvement in risk reclassification: net reclassification improvement was 0.700 (p = 0.002) with RVESV and 0.684 (p = 0.004) with RV strain; corresponding IDI values were 0.0887 (p = 0.03) and 0.1222 (p = 0.01), respectively. Conclusions: Combining CT-based fibrosis quantification with cardiac MRI-derived RV functional assessment enhances the non-invasive diagnosis of PH in ILD patients. This integrated imaging approach significantly improves diagnostic precision and may facilitate earlier, more targeted interventions in the management of ILD-associated PH.
Keywords: computed tomography; interstitial pneumonia; magnetic resonance imaging; pulmonary fibrosis; right ventricular function.
Conflict of interest statement
The authors declare no conflicts of interest.
Figures
Similar articles
-
Doppler trans-thoracic echocardiography for detection of pulmonary hypertension in adults.Cochrane Database Syst Rev. 2022 May 9;5(5):CD012809. doi: 10.1002/14651858.CD012809.pub2. Cochrane Database Syst Rev. 2022. PMID: 35532166 Free PMC article.
-
Cyclophosphamide for connective tissue disease-associated interstitial lung disease.Cochrane Database Syst Rev. 2018 Jan 3;1(1):CD010908. doi: 10.1002/14651858.CD010908.pub2. Cochrane Database Syst Rev. 2018. PMID: 29297205 Free PMC article.
-
Study Design and Rationale for the PHINDER Study: Pulmonary Hypertension Screening in Patients with Interstitial Lung Disease for Earlier Detection.Pulm Ther. 2025 Sep;11(3):491-501. doi: 10.1007/s41030-025-00307-0. Epub 2025 Jul 25. Pulm Ther. 2025. PMID: 40711711 Free PMC article.
-
Right Ventricular Dysfunction in Lung Disease/Hypoxia-Associated Pulmonary Hypertension.J Am Heart Assoc. 2025 Aug 19;14(16):e042186. doi: 10.1161/JAHA.125.042186. Epub 2025 Aug 12. J Am Heart Assoc. 2025. PMID: 40792592
-
Prescription of Controlled Substances: Benefits and Risks.2025 Jul 6. In: StatPearls [Internet]. Treasure Island (FL): StatPearls Publishing; 2025 Jan–. 2025 Jul 6. In: StatPearls [Internet]. Treasure Island (FL): StatPearls Publishing; 2025 Jan–. PMID: 30726003 Free Books & Documents.
References
-
- Ki M.S., Kim S.Y., Kim E.Y., Jung J.Y., Kang Y.A., Park M.S., Kim Y.S., Park S.Y., Lee S.H. Clinical Outcomes and Prognosis of Patients With Interstitial Lung Disease Undergoing Lung Cancer Surgery: A Propensity Score Matching Study. Clin. Lung Cancer. 2023;24:e27–e38. doi: 10.1016/j.cllc.2022.10.003. - DOI - PubMed
-
- Raghu G., Remy-Jardin M., Myers J.L., Richeldi L., Ryerson C.J., Lederer D.J., Behr J., Cottin V., Danoff S.K., Morell F., et al. Diagnosis of Idiopathic Pulmonary Fibrosis. An Official ATS/ERS/JRS/ALAT Clinical Practice Guideline. Am. J. Respir. Crit. Care Med. 2018;198:e44–e68. - PubMed
LinkOut - more resources
Full Text Sources
