

Red Cell Distribution Width (RDW), Platelets and Platelet Index MPV/PLT Ratio as Specific Time Point Predictive Variables of Survival Outcomes in COVID-19 Hospitalized Patients
- PMID: 40807003
- PMCID: PMC12347753
- DOI: 10.3390/jcm14155381
Red Cell Distribution Width (RDW), Platelets and Platelet Index MPV/PLT Ratio as Specific Time Point Predictive Variables of Survival Outcomes in COVID-19 Hospitalized Patients
Abstract
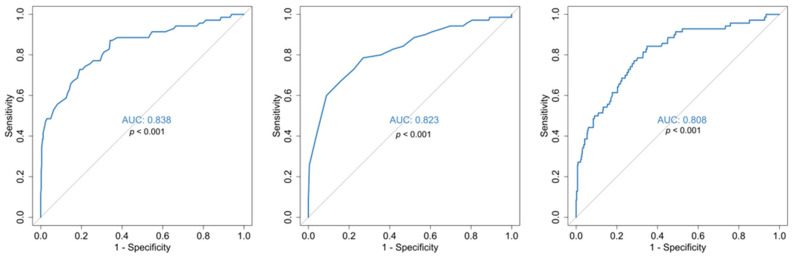
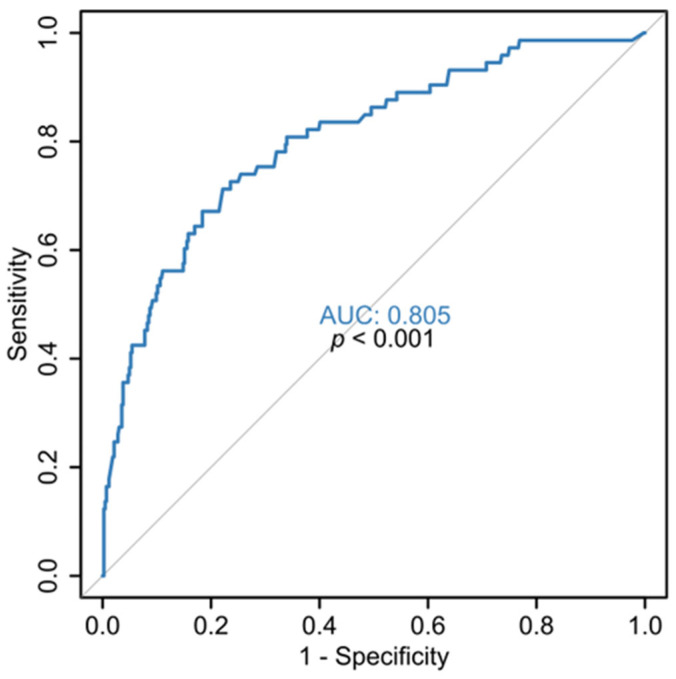
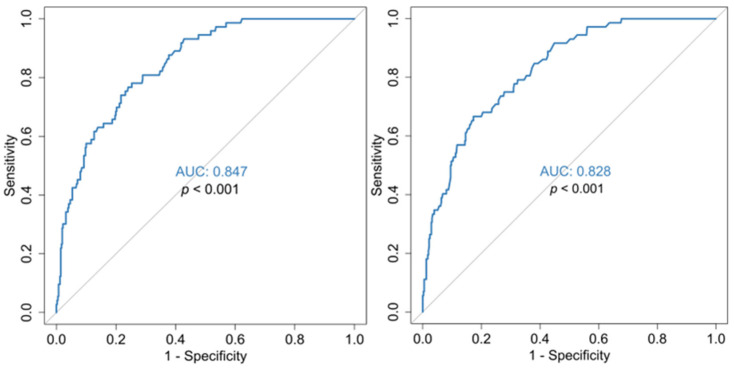
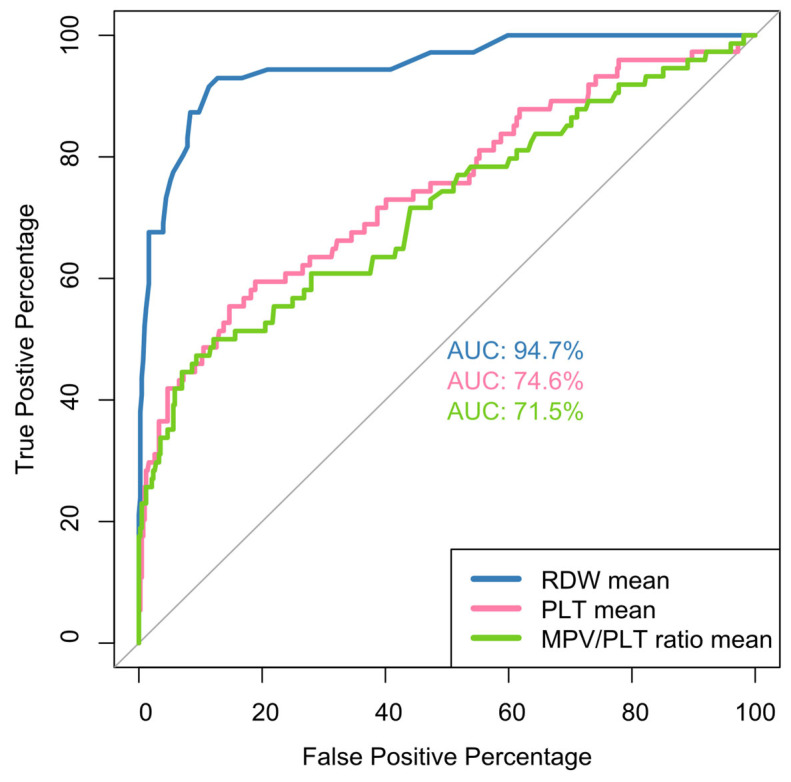
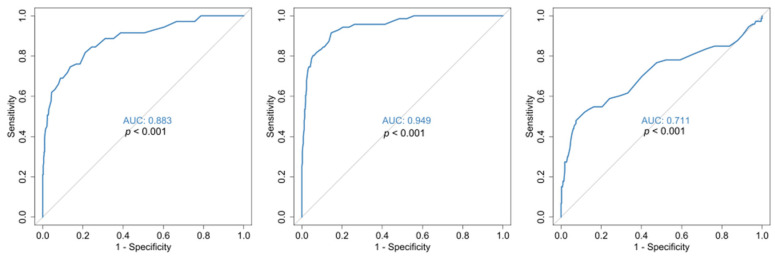
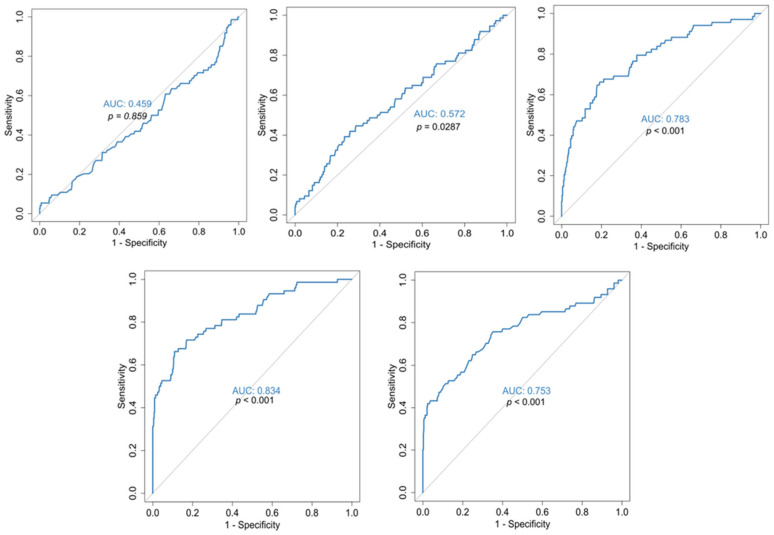
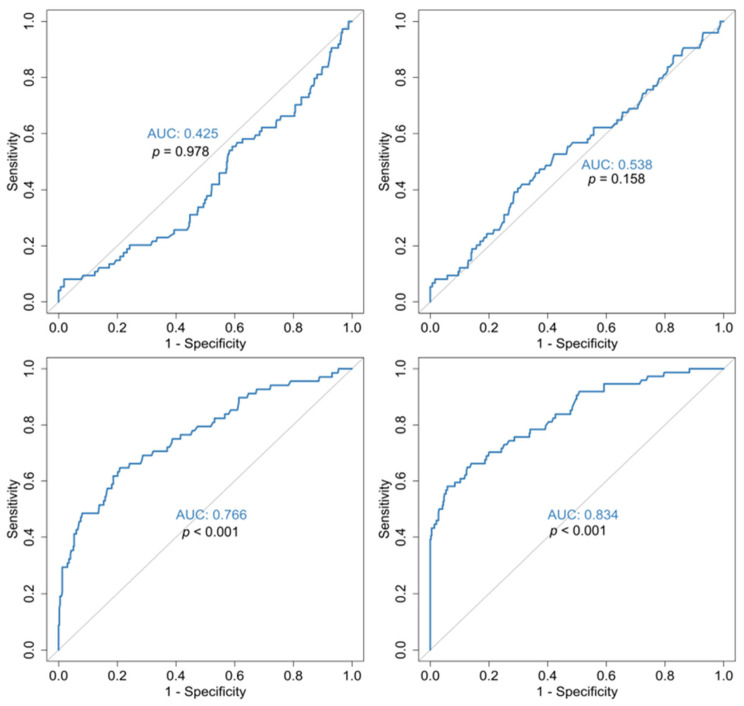
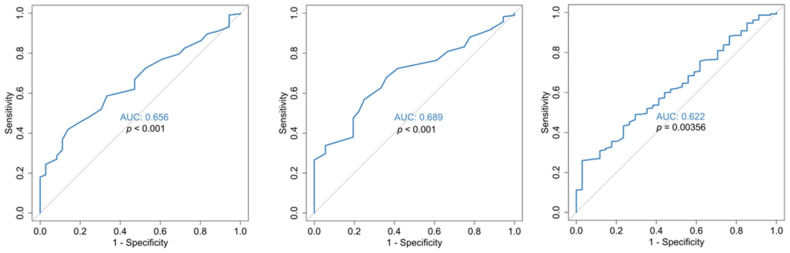
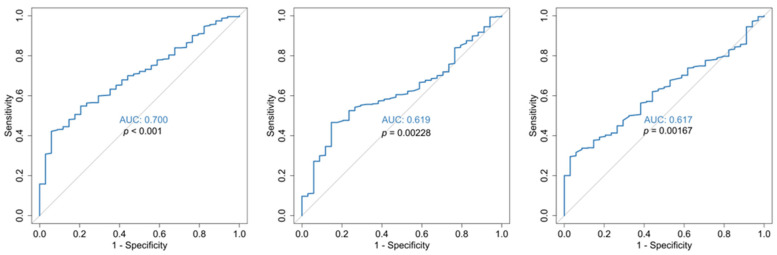
Background: COVID-19-associated coagulopathy (CAC) is a complex condition, with high rates of thrombosis, high levels of inflammation markers and hypercoagulation (increased levels of fibrinogen and D-Dimer), as well as extensive microthrombosis in the lungs and other organs of the deceased. It resembles, without being identical, other coagulation disorders such as sepsis-DIC (SIC/DIC), hemophagocyte syndrome (HPS) and thrombotic microangiopathy (TMA). Platelets (PLTs), key regulators of thrombosis, inflammation and immunity, are considered an important risk mediator in COVID-19 pathogenesis. Platelet index MPV/PLT ratio is reported in the literature as more specific in the prognosis of platelet-related systemic thrombogenicity. Studies of MPV/PLT ratio with regards to the severity of COVID-19 disease are limited, and there are no references regarding this ratio to the outcome of COVID-19 disease at specific time points of hospitalization. The aim of this study is to evaluate the relationship of COVID-19 mortality with the red cell distribution width-coefficient of variation (RDW-CV), platelets and MPV/PLT ratio parameters. Methods: Values of these parameters in 511 COVID-19 hospitalized patients were recorded (a) on admission, (b) as mean values of the 1st and 2nd week of hospitalization, (c) over the total duration of hospitalization, (d) as nadir and zenith values, and (e) at discharge. Results: As for mortality (survivors vs. deceased), statistical analysis with ROC curves showed that regarding the values of the parameters on admission, only the RDW-CV baseline was of prognostic value. Platelet parameters, absolute number and MPV/PLT ratio had predictive potential for the disease outcome only as 2nd week values. On the contrary, with regards to disease severity (mild/moderate versus severe/critical), only the MPV/PLT ratio on admission can be used for prognosis, and to a moderate degree. On multivariable logistic regression analysis, only the RDW-CV mean hospitalization value (RDW-CV mean) was an independent and prognostic variable for mortality. Regarding disease severity, the MPV/PLT ratio on admission and RDW-CV mean were independent and prognostic variables. Conclusions: RDW-CV, platelets and MPV/PLT ratio hematological parameters could be of predictive value for mortality and severity in COVID-19 disease, depending on the hospitalization timeline.
Keywords: COVID-19 disease mortality; PLT; RDW; platelet index MPV/PLT ratio; platelets; red cell distribution width; thrombogenicity index MPV/PLT ratio.
Conflict of interest statement
The authors declare no conflicts of interest.
Figures
Similar articles
-
Platelet Indices and RDW to Assess Inflammatory Milieu in Subclinical Hashimoto's Thyroiditis.Clin Med Insights Endocrinol Diabetes. 2025 Jun 13;18:11795514251349337. doi: 10.1177/11795514251349337. eCollection 2025. Clin Med Insights Endocrinol Diabetes. 2025. PMID: 40528863 Free PMC article.
-
Prescription of Controlled Substances: Benefits and Risks.2025 Jul 6. In: StatPearls [Internet]. Treasure Island (FL): StatPearls Publishing; 2025 Jan–. 2025 Jul 6. In: StatPearls [Internet]. Treasure Island (FL): StatPearls Publishing; 2025 Jan–. PMID: 30726003 Free Books & Documents.
-
[Application value of pediatric sepsis-induced coagulopathy score and mean platelet volume/platelet count ratio in children with sepsis].Zhonghua Wei Zhong Bing Ji Jiu Yi Xue. 2025 Apr;37(4):361-366. doi: 10.3760/cma.j.cn121430-20240629-00554. Zhonghua Wei Zhong Bing Ji Jiu Yi Xue. 2025. PMID: 40814709 Chinese.
-
Signs and symptoms to determine if a patient presenting in primary care or hospital outpatient settings has COVID-19.Cochrane Database Syst Rev. 2022 May 20;5(5):CD013665. doi: 10.1002/14651858.CD013665.pub3. Cochrane Database Syst Rev. 2022. PMID: 35593186 Free PMC article.
-
Risk of thromboembolism in patients with COVID-19 who are using hormonal contraception.Cochrane Database Syst Rev. 2023 Jan 9;1(1):CD014908. doi: 10.1002/14651858.CD014908.pub2. Cochrane Database Syst Rev. 2023. Update in: Cochrane Database Syst Rev. 2023 May 15;5:CD014908. doi: 10.1002/14651858.CD014908.pub3. PMID: 36622724 Free PMC article. Updated.
References
-
- Chorba T. The Concept of the Crown and Its Potential Role in the Downfall of Coronavirus. Emerg. Infect. Dis. 2020;26:2302–2305. doi: 10.3201/eid2609.AC2609. - DOI
-
- Azab B., Torbey E., Hatoum H., Singh J., Khoueiry G., Bachir R., McGinn J.T., Jr., McCord D., Lafferty J. Usefulness of red cell distribution width in predicting all-cause long-term mortality after non-ST-elevation myocardial infarction. Cardiology. 2011;119:72–80. doi: 10.1159/000329920. - DOI - PubMed
LinkOut - more resources
Full Text Sources
Research Materials
