. 2025 Jul 24;14(15):2600.
doi: 10.3390/foods14152600.

Evaluation of the Biological Properties and Antibacterial Activities of the Natural Food Supplement "Epavin" for Liver Detoxification and Protection

Affiliations

Evaluation of the Biological Properties and Antibacterial Activities of the Natural Food Supplement "Epavin" for Liver Detoxification and Protection

Alexia Barbarossa et al. Foods. .

Abstract

Background/objectives: The liver, the body's primary detoxifying organ, is often affected by various inflammatory diseases, including hepatitis, cirrhosis, and non-alcoholic fatty liver disease (NAFLD), many of which can be exacerbated by secondary infections such as spontaneous bacterial peritonitis, bacteremia, and sepsis-particularly in patients with advanced liver dysfunction. The global rise in these conditions underscores the need for effective interventions. Natural products have attracted attention for their potential to support liver health, particularly through synergistic combinations of plant extracts. Epavin, a dietary supplement from Erbenobili S.r.l., formulated with plant extracts like Taraxacum officinale (L.), Silybum marianum (L.) Gaertn., and Cynara scolymus (L.), known for their liver-supporting properties, has been proposed as adjuvant for liver functions. The aim of this work was to evaluate of Epavin's antioxidant, anti-inflammatory, and protective effects against heavy metal-induced toxicity. In addition, the antibacterial effect of Epavin against a panel of bacterial strains responsible for infections associated with liver injuries has been evaluated.

Methods: The protection against oxidative stress induced by H2O2 was evaluated in HepG2 and BALB/3T3 cells using the dichlorofluorescein diacetate (DCFH-DA) assay. Its anti-inflammatory activity was investigated by measuring the reduction in nitric oxide (NO) production in LPS-stimulated RAW 264.7 macrophages using the Griess assay. Additionally, the cytoprotecting of Epavin against heavy metal-induced toxicity and oxidative stress were evaluated in HepG2 cells using the [3-(4,5-dimethylthiazol-2-yl)-2,5-diphenyl-tetrazolium bromide] (MTT) and DCFH-DA assays. The antibacterial activity of Epavin was assessed by determining the minimum inhibitory concentration (MIC) and the minimum bactericidal concentration (MBC) against Gram-positive (Enterococcus faecalis ATCC 29212, and BS, Staphylococcus aureus 25923, 29213, 43300, and BS) and Gram-negative (Escherichia coli 25922, and BS, Klebsiella pneumoniae 13883, 70063, and BS) bacterial strains using the microdilution method in broth, following the Clinical and Laboratory Standards Institute's (CLSI) guidelines.

Results: Epavin effectively reduced oxidative stress in HepG2 and BALB/3T3 cells and decreased NO production in LPS-stimulated RAW 264.7 macrophages. Moreover, Epavin demonstrated a protective effect against heavy metal-induced toxicity and oxidative damage in HepG2 cells. Finally, it exhibited significant antibacterial activity against both Gram-positive and Gram-negative bacterial strains, with MIC values ranging from 1.5 to 6.0 mg/mL.

Conclusions: The interesting results obtained suggest that Epavin may serve as a valuable natural adjuvant for liver health by enhancing detoxification processes, reducing inflammation, and exerting antibacterial effects that could be beneficial in the context of liver-associated infections.

Keywords: antibacterial activity; antioxidants; bioactive compounds; heavy metals; hepatotoxicity.


Conflict of interest statement

The authors declare no conflicts of interest.

Figures

Figure 1
Figure 1
HPLC-DAD chromatogram of Epavin at 350 nm. The number of peaks aligns with that listed in Table 1.
Figure 2
Figure 2
DCFH oxidation in HepG2 (a) and BALB-3T3 (b) cells after exposure to H2O2, 50 μM, and different concentrations of Epavin (125–500 µg/mL). “+” indicates the presence and “−” the absence of treatment. The results are shown as mean ± standard deviation (SD) (n = 3). Significant differences versus CTRL: ** p < 0.01, and **** p < 0.0001.
Figure 3
Figure 3
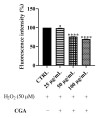
DCFH oxidation in HepG2 cells after exposure to H2O2, 50 μM, and different concentrations of CGA (25–100 µg/mL). “+” indicates the presence and “−” the absence of treatment. The results are shown as mean ± standard deviation (SD) (n = 3). Significant differences versus CTRL: * p < 0.05, and **** p < 0.0001.
Figure 4
Figure 4
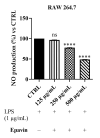
Effect of Epavin on nitric oxide (NO) production in LPS-stimulated RAW 264.7 macrophages. The cells were treated with LPS (1 µg/mL) in the presence or absence of Epavin at different concentrations (125, 250 and 500 µg/mL). “+” indicates the presence and “−” the absence of treatment. NO levels were measured using the Griess assay and expressed as a percentage relative to the LPS-treated control (the CTRL results are shown as mean ± standard deviation (SD) (n = 3). Significant differences versus CTRL: non-significant differences (ns, p > 0.05), and **** p < 0.0001.
Figure 5
Figure 5
Effect of CGA on nitric oxide (NO) production in LPS-stimulated RAW 264.7 macrophages. The cells were treated with LPS (1 µg/mL) in the presence or absence of CGA at different concentrations (25, 50 and 100 µg/mL). “+” indicates the presence and “−” the absence of treatment. NO levels were measured using the Griess assay and expressed as a percentage relative to the LPS-treated control (CTRL Results are shown as mean ± standard deviation (SD) (n = 3). Significant differences versus CTRL: non-significant differences (ns, p > 0.05), and **** p < 0.0001.
Figure 6
Figure 6
Effects on HepG2 of Cd2+ (a), Hg2+ (b), and Pb2+ (c) (1–100 μM) cell viability after 24 h of exposure. The results are shown as mean ± standard deviation (SD) (n = 3). Significant differences versus the control (CTRL): non-significant differences (ns, p > 0.05), ** p < 0.01, and **** p < 0.0001.
Figure 7
Figure 7
Effects on HepG2 cell viability of Cd2+ (a), Hg2+ (b), and Pb2+ (c), at the concentration of 30 μM; and the effects of co-treatment of Cd2+ 30 μM (a), Hg2+ 30 μM (b), and Pb2+ 30 μM (c), on HegG2 cell viability with different concentration of Epavin (125–500 μg/mL) after 24 h of co-treatment. “+” indicates the presence and “−” the absence of treatment. The results are shown as mean ± standard deviation (SD) (n = 3). Significant differences in co-treatments versus Cd2+, Hg2+ or Pb2+ alone, respectively: nonsignificant differences (ns, p > 0.05), * p < 0.05, ** p < 0.01, and **** p < 0.0001. Significant differences versus control (CTRL): #### p < 0.0001.
Figure 8
Figure 8
Effects on HepG2 cell viability of Cd2+ (a), Hg2+ (b), and Pb2+ (c), at the concentration of 30 μM, and CGA (25−100 μg/mL) after 24 h of co-treatment. “+” indicates the presence and “−” the absence of treatment. The results are shown as mean ± standard deviation (SD) (n = 3). Significant differences versus Cd2+, Hg2+ or Pb2+: nonsignificant differences (ns, p > 0.05), * p < 0.05, *** p < 0.001 and **** p < 0.0001. Significant differences versus control (CTRL): #### p < 0.0001.
Figure 9
Figure 9
DCFH oxidation in HepG2 cells after exposure to Cd2+ (a), Pb2+ (b), or Hg2+ (c) (30 μM), and different concentrations of Epavin (125−500 µg/mL). “+” indicates the presence and “−” the absence of treatment. The results are shown as mean ± standard deviation (SD) (n = 3). Significant differences versus Cd2+, Hg2+ or Pb2+: non-significant differences (ns, p > 0.05), * p < 0.05, and **** p < 0.0001. Significant differences versus control (CTRL): #### p < 0.0001.
Figure 10
Figure 10
DCFH oxidation in HepG2 cells after exposure to Cd2+ (a), Pb2+ (b), or Hg2+ (c), (30 μM) and different concentrations of CGA (25−100 µg/mL). “+” indicates the presence and “−” the absence of treatment. The results are shown as mean ± standard deviation (SD) (n = 3). Significant differences versus Cd2+, Hg2+ or Pb2+: non-significant differences (ns, p > 0.05), * p < 0.05, ** p < 0.01, *** p < 0.001, and **** p < 0.0001. Significant differences versus control (CTRL): #### p < 0.0001.

Similar articles

  • Prescription of Controlled Substances: Benefits and Risks.
    Preuss CV, Kalava A, King KC. Preuss CV, et al. 2025 Jul 6. In: StatPearls [Internet]. Treasure Island (FL): StatPearls Publishing; 2025 Jan–. 2025 Jul 6. In: StatPearls [Internet]. Treasure Island (FL): StatPearls Publishing; 2025 Jan–. PMID: 30726003 Free Books & Documents.
  • [Volume and health outcomes: evidence from systematic reviews and from evaluation of Italian hospital data].
    Amato L, Colais P, Davoli M, Ferroni E, Fusco D, Minozzi S, Moirano F, Sciattella P, Vecchi S, Ventura M, Perucci CA. Amato L, et al. Epidemiol Prev. 2013 Mar-Jun;37(2-3 Suppl 2):1-100. Epidemiol Prev. 2013. PMID: 23851286 Italian.
  • Management of urinary stones by experts in stone disease (ESD 2025).
    Papatsoris A, Geavlete B, Radavoi GD, Alameedee M, Almusafer M, Ather MH, Budia A, Cumpanas AA, Kiremi MC, Dellis A, Elhowairis M, Galán-Llopis JA, Geavlete P, Guimerà Garcia J, Isern B, Jinga V, Lopez JM, Mainez JA, Mitsogiannis I, Mora Christian J, Moussa M, Multescu R, Oguz Acar Y, Petkova K, Piñero A, Popov E, Ramos Cebrian M, Rascu S, Siener R, Sountoulides P, Stamatelou K, Syed J, Trinchieri A. Papatsoris A, et al. Arch Ital Urol Androl. 2025 Jun 30;97(2):14085. doi: 10.4081/aiua.2025.14085. Epub 2025 Jun 30. Arch Ital Urol Androl. 2025. PMID: 40583613 Review.
  • The Black Book of Psychotropic Dosing and Monitoring.
    DeBattista C, Schatzberg AF. DeBattista C, et al. Psychopharmacol Bull. 2024 Jul 8;54(3):8-59. Psychopharmacol Bull. 2024. PMID: 38993656 Free PMC article. Review.
  • Ophthalmia Neonatorum.
    Castro Ochoa KJ, Gurnani B. Castro Ochoa KJ, et al. 2025 Jul 7. In: StatPearls [Internet]. Treasure Island (FL): StatPearls Publishing; 2025 Jan–. 2025 Jul 7. In: StatPearls [Internet]. Treasure Island (FL): StatPearls Publishing; 2025 Jan–. PMID: 31855399 Free Books & Documents.

References

    1. Cione E., Abrego Guandique D.M., Caroleo M.C., Luciani F., Colosimo M., Cannataro R. Liver Damage and microRNAs: An Update. Curr. Issues Mol. Biol. 2023;45:78–91. doi: 10.3390/cimb45010006. - DOI - PMC - PubMed
    1. Uchida D., Takaki A., Oyama A., Adachi T., Wada N., Onishi H., Okada H. Oxidative Stress Management in Chronic Liver Diseases and Hepatocellular Carcinoma. Nutrients. 2020;12:1576. doi: 10.3390/nu12061576. - DOI - PMC - PubMed
    1. Arroyo V., Angeli P., Moreau R., Jalan R., Clària J., Trebicka J., Fernández J., Gustot T., Caraceni P., Bernardi M., et al. The systemic inflammation hypothesis: Towards a new paradigm of acute decompensation and multiorgan failure in cirrhosis. J. Hepatol. 2021;74:670–685. doi: 10.1016/j.jhep.2020.11.048. - DOI - PubMed
    1. Huang C.-H., Lee C.-H., Chang C. Spontaneous Bacterial Peritonitis in Decompensated Liver Cirrhosis—A Literature Review. Livers. 2022;2:214–232. doi: 10.3390/livers2030018. - DOI
    1. Seen S. Chronic liver disease and oxidative stress—A narrative review. Expert. Rev. Gastroenterol. Hepatol. 2021;15:1021–1035. doi: 10.1080/17474124.2021.1949289. - DOI - PubMed

LinkOut - more resources