. 2025 Jul 30;14(15):2678.
doi: 10.3390/foods14152678.

In Vitro Neuroprotective Effects of a Mixed Extract of Bilberry, Centella asiatica, Hericium erinaceus, and Palmitoylethanolamide

Affiliations

In Vitro Neuroprotective Effects of a Mixed Extract of Bilberry, Centella asiatica, Hericium erinaceus, and Palmitoylethanolamide

Rebecca Galla et al. Foods. .

Abstract

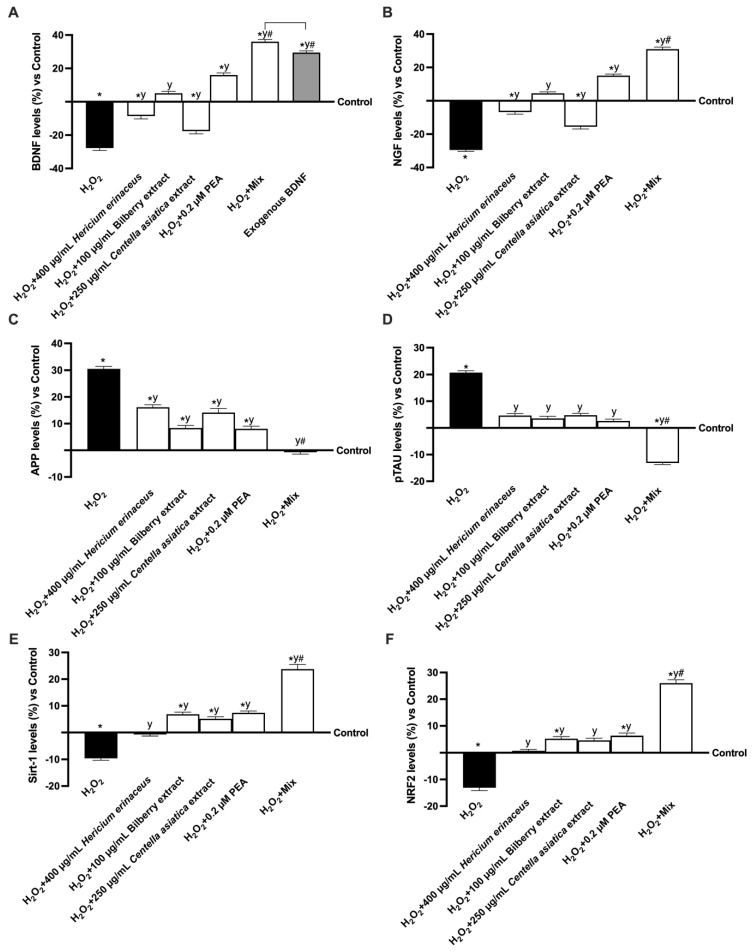
Oxidative stress, driven by impaired antioxidant defence systems, is a major contributor to cognitive decline and neurodegenerative processes in brain ageing. This study investigates the neuroprotective effects of a natural compound mixture-composed of Hericium erinaceus, Palmitoylethanolamide, Bilberry extract, and Centella asiatica-using a multi-step in vitro strategy. An initial evaluation in a 3D intestinal epithelial model demonstrated that the formulation preserves barrier integrity and may be bioaccessible, as evidenced by transepithelial electrical resistance (TEER) and the expression of tight junctions. Subsequent analysis in an integrated gut-brain axis model under oxidative stress conditions revealed that the formulation significantly reduces inflammatory markers (NF-κB, TNF-α, IL-1β, and IL-6; about 1.5-fold vs. H2O2), reactive oxygen species (about 2-fold vs. H2O2), and nitric oxide levels (about 1.2-fold vs. H2O2). Additionally, it enhances mitochondrial activity while also improving antioxidant responses. In a co-culture of neuronal and astrocytic cells, the combination upregulates neurotrophic factors such as BDNF and NGF (about 2.3-fold and 1.9-fold vs. H2O2). Crucially, the formulation also modulates key biomarkers associated with cognitive decline, reducing APP and phosphorylated tau levels (about 98% and 1.6-fold vs. H2O2) while increasing Sirtuin 1 and Nrf2 expression (about 3.6-fold and 3-fold vs. H2O2). These findings suggest that this nutraceutical combination may support the cellular pathways involved in neuronal resilience and healthy brain ageing, offering potential as a functional food ingredient or dietary supplement.

Keywords: anti-inflammatory; natural extracts; neurotrophins; oral supplementation; oxidative stress.


Conflict of interest statement

Author Rebecca Galla was employed by noiVita S.r.l.s and had no influence on the interpretation of the data. In addition, Francesca Uberti is a co-founder of noiVita S.r.l.s without a role in the interpretation of data. The other authors declared no conflict of interest and that the research was conducted without commercial or financial relationships that could be construed as a potential conflict of interest.

Figures

Figure A1
Figure A1
Particle size distribution analysis of PEA.
Figure 1
Figure 1
A schematic representation of the experimental methodology is divided into phases.
Figure 2
Figure 2
Time-course and dose–response analysis of Caco-2 cell viability. In (A) Hericium erinaceus, * p < 0.05 vs. control; # p < 0.05 vs. 200 µg/mL Hericium erinaceus; y p < 0.05 vs. 100 µg/mL Hericium erinaceus. In (B), Bilberry extract, * p < 0.05 vs. control; # p < 0.05 vs. 250 µg/mL Bilberry extract; y p < 0.05 vs. 100 µg/mL Bilberry extract; z p < 0.05 vs. 500 µg/mL Bilberry extract. In (C), Centella asiatica extract, * p < 0.05 vs. control; # p < 0.05 vs. 1000 µg/mL Centella asiatica extract; y p < 0.05 vs. 500 µg/mL Centella asiatica extract. In (D), PEA, * p < 0.05 vs. control; # p < 0.05 vs. 0.1 µM PEA; y p < 0.05 vs. 0.4 µM PEA. Compared to the control values (0% line), the data are presented as the mean (%) ± SD of five experiments conducted in triplicate.
Figure 3
Figure 3
A model of the intestinal barrier in vitro. Cell viability analysis of the combination, all the agents p < 0.05 vs. control except 400 μg/mL Hericium erinaceus at 6 h and 100 µg/mL Bilberry extract a 1h, # p < 0.05 vs. single agents (A); the TEER value is assessed using EVOM3, all the agents p < 0.05 vs. control except 400 μg/mL Hericium erinaceus at 6 h, # p < 0.05 vs. single agents (B); the study of tight junctions is conducted via ELISA tests for claudin-1, occludin, and ZO-1, all the agents p < 0.05 vs. control, # p < 0.05 vs. single agents (CE); the evaluation of passage through the intestinal barrier is performed using a fluorescent trace, all the agents p < 0.05 vs. control except 400 μg/mL Hericium erinaceus at 1 h and 2 h, # p < 0.05 vs. single agents (F). Five separate tests were conducted in triplicate, and the results are presented as means ± SD (%), compared to the control values (the 0% line). Mix = 400 μg/mL Hericium erinaceus + 100 µg/mL Bilberry extract +250 μg/mL Centella asiatica + 0.2 μM of PEA.
Figure 4
Figure 4
Evaluation of the effects on the gut–brain axis under oxidative stress. In (A) cell viability analysis by MTT test; in (B) NO production analysis; in (C) ROS production analysis measured through cytochrome C reduction; in (D) SOD level analysis measured through ELISA kit; in (E) GPx production analysis; in (F) lipid peroxidation analysis. Data from five experiments, performed in triplicate, are presented as averages ± SD (%) and compared to the control values (0% line). The abbreviations are the same as Figure 3. * p < 0.05 vs. control; y p < 0.05 vs. 200 µM H2O2; # p < 0.05 vs. single agents.
Figure 5
Figure 5
Analysis of inflammatory processes and calcium levels. In (A) TNFα quantification analysis, (B) NFkB quantification analysis, (C) IL-1β quantification analysis, and (D) IL-6 quantification analysis by ELISA Kit; in (E) calcium quantification analysis. All the analyses were performed using a specific kit. Data from five experiments in triplicate are presented as averages ± SD (%) and compared to the control values (0% line). The abbreviations are the same as Figure 3. * p < 0.05 vs. control; y p < 0.05 vs. 200 µM H2O2; # p < 0.05 vs. single agents.
Figure 6
Figure 6
Analysis of cellular energy. In (A), mitochondrial potential membrane analysis; in (B), oxygen consumption analysis; in (C) ATP level analysis. All the analyses were performed using the ELISA test. The data are reported as means ± SD (%) of five independent experiments performed in triplicate and compared to the control values (the 0% line). The abbreviations are the same as Figure 3. * p < 0.05 vs. control; y p < 0.05 vs. 200 µM H2O2; # p < 0.05 vs. single agents.
Figure 7
Figure 7
Evaluation of neurotrophins involved in cognitive decline in vitro. In (A), BDNF quantification, α p < 0.05 vs. control; β p < 0.05 vs. 200 µM H2O2; γ p < 0.05 vs. single agents; δ p < 0.05 vs. exogenous BDNF (use concentration 10 ng/mL); in (B) NGF quantification; in (C) APP quantification; in (D) pTAU quantification; in (E) Sirt-1 quantification; in (F) NRF2 quantification. All the analyses were performed using the ELISA test. The data are reported as means ± SD (%) of five independent experiments performed in triplicate and compared to the control values (represented by the 0% line). The abbreviations are the same as Figure 3. * p < 0.05 vs. control; y p < 0.05 vs. 200 µM H2O2; # p < 0.05 vs. single agents; the bar p < 0.05 vs. exogenous BDNF.

Similar articles

References

    1. Yang Y., Wang D., Hou W., Li H. Cognitive Decline Associated with Aging. Adv. Exp. Med. Biol. 2023;1419:25–46. doi: 10.1007/978-981-99-1627-6_3. - DOI - PubMed
    1. Barter J.D., Foster T.C. Aging in the Brain: New Roles of Epigenetics in Cognitive Decline. Neuroscientist. 2018;24:516–525. doi: 10.1177/1073858418780971. - DOI - PubMed
    1. Starnawska A., Tan Q., McGue M., Mors O., Børglum A.D., Christensen K., Nyegaard M., Christiansen L. Epigenome-Wide Association Study of Cognitive Functioning in Middle-Aged Monozygotic Twins. Front. Aging Neurosci. 2017;9:413. doi: 10.3389/fnagi.2017.00413. - DOI - PMC - PubMed
    1. Bathina S., Das U.N. Brain-derived neurotrophic factor and its clinical implications. Arch. Med. Sci. 2015;11:1164–1178. doi: 10.5114/aoms.2015.56342. - DOI - PMC - PubMed
    1. Romanczyk T.B., Weickert C.S., Webster M.J., Herman M.M., Akil M., Kleinman J.E. Alterations in trkB mRNA in the human prefrontal cortex throughout the lifespan. Eur. J. Neurosci. 2002;15:269–280. doi: 10.1046/j.0953-816x.2001.01858.x. - DOI - PubMed

LinkOut - more resources