. 2025 Aug 1;14(15):2714.
doi: 10.3390/foods14152714.

Disaccharides and Fructooligosaccharides (FOS) Production by Wild Yeasts Isolated from Agave

Affiliations

Disaccharides and Fructooligosaccharides (FOS) Production by Wild Yeasts Isolated from Agave

Yadira Belmonte-Izquierdo et al. Foods. .

Abstract

Fructooligosaccharides (FOS) are short fructans with different degrees of polymerization (DP) and bonds in their structure, generated by the distinct activities of fructosyltransferase enzymes, which produce distinct types of links. FOS are in high demand on the market, mainly because of their prebiotic effects. In recent years, depending on the link type in the FOS structure, prebiotic activity has been shown to be increased. Studies on β-fructanofuranosidases (Ffasa), enzymes with fructosyltransferase activity in yeasts, have reported the production of 1F-FOS, 6F-FOS, and 6G-FOS. The aims of this investigation were to evaluate the capability of fifteen different yeasts to grow in Agave sp. juices and to determine the potential of these juices as substrates for FOS production. Additionally, the research aimed to corroborate and analyze the fructosyltransferase activity of enzymatic extracts obtained from agave yeasts by distinct induction media and to identify the role and optimal parameters (time and sucrose and glucose concentrations) for FOS and disaccharides production through Box-Behnken designs. To carry out such a task, different techniques were employed: FT-IR, TLC, and HPAEC-PAD. We found two yeasts with fructosyltransferase activity, P. kudriavzevii ITMLB97 and C. lusitaniae ITMLB85. In addition, within the most relevant results, the production of the FOS 1-kestose, 6-kestose, and neokestose, as well as disaccharides inulobiose, levanobiose, and blastose, molecules with potential applications, was determined. Overall, FOS production requires suitable yeast species, which grow in a medium under optimal conditions, from which microbial enzymes with industrial potential can be obtained.

Keywords: 6-kestose; blastose; fructooligosaccharides; yeast.


Conflict of interest statement

The authors declare that they have no conflicts of interest.

Figures
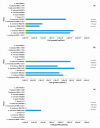
Figure 2
Figure 2
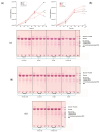
Yeast growth in agave juices (P = pine head juice, BS = base of scape juice, BL = base of leaf juice, and L = leaf juice) at 30 h at different temperatures: (a) 25 °C, (b) 35 °C, and (c) 45 °C. The color in the graphics represents the cell growth in the corresponding juice; in some cases, the color is not visible due to the absence of growth. Each bar represents the average of three replicates.
Figure 1
Figure 1
(a) Agave juices for fermentation (P = pine head juice, BS = base of scape juice, BL = base of the leaf juice, and L = leaf juice); (b) TLC of the agave juices using aniline as a derivatizing reagent (FOS = fructooligosaccharides standard from Megazyme). The difference in the color of the bands is produced after derivatization with aniline, which depends on the type of glycosidic bond present in the structures. If glucose is present, dark blue bands appear, while if fructose is present, pinkish-reddish bands appear.
Figure 3
Figure 3
Cell growth comparison of (a) P. kudriavzevii ITMLB97, (b) K. marxianus ITMLB106, and (c) C. lusitaniae ITMLB85 with different sucrose concentrations (1.5, 20, and 40%) at 30 °C. For cell growth at 56 h, different letters indicate significant differences according to Tukey’s test for α = 0.05, n = 3. TLC of the fermentation products with (df) P. kudriavzevii ITMLB97 and (gi) C. lusitaniae ITMLB85 at different temperatures (23, 30, and 37 °C), sucrose concentrations (20 and 40%), and times (0, 24, 48, and 56 h). DP5 = 1-F-fructofuranosylnystose.
Figure 3
Figure 3
Cell growth comparison of (a) P. kudriavzevii ITMLB97, (b) K. marxianus ITMLB106, and (c) C. lusitaniae ITMLB85 with different sucrose concentrations (1.5, 20, and 40%) at 30 °C. For cell growth at 56 h, different letters indicate significant differences according to Tukey’s test for α = 0.05, n = 3. TLC of the fermentation products with (df) P. kudriavzevii ITMLB97 and (gi) C. lusitaniae ITMLB85 at different temperatures (23, 30, and 37 °C), sucrose concentrations (20 and 40%), and times (0, 24, 48, and 56 h). DP5 = 1-F-fructofuranosylnystose.
Figure 4
Figure 4
Cell growth of (a) P. kudriavzevii ITMLB97 and (b) C. lusitaniae ITMLB85 with surfactants at a 20% sucrose concentration in the media over time. For cell growth at 72 h, different letters indicate significant differences according to Tukey’s test for α = 0.05, n = 3. (ce) TLC of the fermentation products for both yeasts, where increases in the FOS region over time were observed.
Figure 5
Figure 5
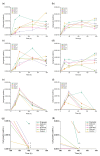
Grown kinetics of (a,c,e) P. kudriavzevii ITMLB97 and (b,d,f) C. lusitaniae ITMLB85 with different carbon sources and nutrients. P. kudriavzevii ITMLB97 used as a carbon source: (a) FOS, (c) inulin, and (e) BS-juice; C. lusitaniae ITMLB85 used as a carbon source: (b) FOS, (d) inulin, and (f) BS-juice. (g,h) Approaches to the kinetics of cell growth of P. kudriavzevii ITMLB97 or C. lusitaniae ITMLB85 at 192 h, with BS-juice used as a carbon source. For cell growth at 192 h, different letters indicate significant differences according to Tukey’s test for α = 0.05, n = 3.
Figure 6
Figure 6
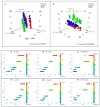
PCA of (a) P. kudriavzevii ITMLB97 and (b) C. lusitaniae ITMLB85 with different carbon sources. OPLS for P. kudriavzevii ITMLB97 over time using (c) FOS, (d) inulin, and (e) BS-juice. OPLS results for C. lusitaniae ITMLB85 over time when (f) FOS, (g) inulin, and (h) BS-juice were used.
Figure 7
Figure 7
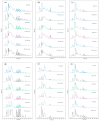
HPAEC-PAD chromatograms of fermentation products from (ac) P. kudriavzevii ITMLB97 and (df) C. lusitaniae ITMLB85 subjected to different carbon sources and nutrients. P. kudriavzevii ITMLB97 with different carbon sources: (a) FOS, (b) inulin, and (c) BS-juice; C. lusitaniae ITMLB85 with different carbon source: (d) FOS, (e) inulin, and (f) BS-juice. The gray chromatograms correspond to samples at 0 h, and the color chromatograms correspond to treatments at 192 h. G = glucose, F = fructose, S = sucrose, K = 1-kestose, B = blastose, Ib = inulobiose, 6K = 6-kestose, and Lb = levanobiose.
Figure 8
Figure 8
HPAEC-PAD chromatograms of the reaction products from different treatments established by the Box–Behnken designs using distinct enzymatic extracts of P. kudriavzevii ITMLB97 or C. lusitaniae ITMLB85: (a) EE-Pk-Ch, (b) EE-Pk-NM, (c) EE-Cl-Ch, (d) EE-Cl-NM. Figures (ad) show the products in treatments 1, 3, 5, 7, and 9 at 12 h (indicated by 4): G = glucose, F = fructose, K = 1-kestose, B = blastose, Ib = inulobiose, 6K = 6-kestose, nK = neo-kestose, and ? = unknown fructooligosaccharide between DP5-DP6 .
Figure 9
Figure 9
Response surfaces generated for disaccharides and FOS production by enzymatic extracts of P. kudriavzevii ITMLB97 (a) EE-Pk-Ch and (b) EE-Pk-NM and C. lusitaniae ITMLB85 (c) EE-Cl-Ch and (d) EE-Cl-NM. K = 1-kestose, B = blastose, Ib = inulobiose, 6K = 6-kestose, Lb = levanobiose, and nK = neo-kestose. The increase in disaccharides or FOS production varies depending on the enzyme extract used in the reaction. SR colors are associated with higher or lower disaccharides or FOS production. Production by colors, from lowest to highest, is described below: dark blue, light blue, green, yellow, orange, and red.
Figure 9
Figure 9
Response surfaces generated for disaccharides and FOS production by enzymatic extracts of P. kudriavzevii ITMLB97 (a) EE-Pk-Ch and (b) EE-Pk-NM and C. lusitaniae ITMLB85 (c) EE-Cl-Ch and (d) EE-Cl-NM. K = 1-kestose, B = blastose, Ib = inulobiose, 6K = 6-kestose, Lb = levanobiose, and nK = neo-kestose. The increase in disaccharides or FOS production varies depending on the enzyme extract used in the reaction. SR colors are associated with higher or lower disaccharides or FOS production. Production by colors, from lowest to highest, is described below: dark blue, light blue, green, yellow, orange, and red.

Similar articles

  • Prescription of Controlled Substances: Benefits and Risks.
    Preuss CV, Kalava A, King KC. Preuss CV, et al. 2025 Jul 6. In: StatPearls [Internet]. Treasure Island (FL): StatPearls Publishing; 2025 Jan–. 2025 Jul 6. In: StatPearls [Internet]. Treasure Island (FL): StatPearls Publishing; 2025 Jan–. PMID: 30726003 Free Books & Documents.
  • Signs and symptoms to determine if a patient presenting in primary care or hospital outpatient settings has COVID-19.
    Struyf T, Deeks JJ, Dinnes J, Takwoingi Y, Davenport C, Leeflang MM, Spijker R, Hooft L, Emperador D, Domen J, Tans A, Janssens S, Wickramasinghe D, Lannoy V, Horn SRA, Van den Bruel A; Cochrane COVID-19 Diagnostic Test Accuracy Group. Struyf T, et al. Cochrane Database Syst Rev. 2022 May 20;5(5):CD013665. doi: 10.1002/14651858.CD013665.pub3. Cochrane Database Syst Rev. 2022. PMID: 35593186 Free PMC article.
  • Management of urinary stones by experts in stone disease (ESD 2025).
    Papatsoris A, Geavlete B, Radavoi GD, Alameedee M, Almusafer M, Ather MH, Budia A, Cumpanas AA, Kiremi MC, Dellis A, Elhowairis M, Galán-Llopis JA, Geavlete P, Guimerà Garcia J, Isern B, Jinga V, Lopez JM, Mainez JA, Mitsogiannis I, Mora Christian J, Moussa M, Multescu R, Oguz Acar Y, Petkova K, Piñero A, Popov E, Ramos Cebrian M, Rascu S, Siener R, Sountoulides P, Stamatelou K, Syed J, Trinchieri A. Papatsoris A, et al. Arch Ital Urol Androl. 2025 Jun 30;97(2):14085. doi: 10.4081/aiua.2025.14085. Epub 2025 Jun 30. Arch Ital Urol Androl. 2025. PMID: 40583613 Review.
  • Sexual Harassment and Prevention Training.
    Cedeno R, Bohlen J. Cedeno R, et al. 2024 Mar 29. In: StatPearls [Internet]. Treasure Island (FL): StatPearls Publishing; 2025 Jan–. 2024 Mar 29. In: StatPearls [Internet]. Treasure Island (FL): StatPearls Publishing; 2025 Jan–. PMID: 36508513 Free Books & Documents.
  • Systemic treatments for metastatic cutaneous melanoma.
    Pasquali S, Hadjinicolaou AV, Chiarion Sileni V, Rossi CR, Mocellin S. Pasquali S, et al. Cochrane Database Syst Rev. 2018 Feb 6;2(2):CD011123. doi: 10.1002/14651858.CD011123.pub2. Cochrane Database Syst Rev. 2018. PMID: 29405038 Free PMC article.

References

    1. Singh R.S., Singh R.P., Kennedy J.F. Recent insights in enzymatic synthesis of fructooligosaccharides from inulin. Int. J. Biol. Macromol. 2016;85:565–572. doi: 10.1016/j.ijbiomac.2016.01.026. - DOI - PubMed
    1. Banguela A., Hernández L. Fructans: From natural sources to transgenic plants. Biotecnol. Apl. 2006;23:202–210.
    1. Huazano-García A., Silva-Adame M.B., Vázquez-Martínez J., Gastelum-Arellanez A., Sánchez-Segura L., López M.G. Highly branched neo-fructans (Agavins) attenuate metabolic endotoxemia and low-grade inflammation in association with gut microbiota modulation on high-fat diet-fed mice. Foods. 2020;9:1792. doi: 10.3390/foods9121792. - DOI - PMC - PubMed
    1. De la Rosa O., Flores-Gallegos A.C., Muñíz-Marquez D., Nobre C., Contreras-Esquivel J.C., Aguilar C.N. Fructooligosaccharides production from agro-wastes as alternative low-cost source. Trends Food Sci. Technol. 2019;91:139–146. doi: 10.1016/j.tifs.2019.06.013. - DOI
    1. Nguyen T.T. The cholesterol-lowering action of plant stanol esters. J. Nutr. 1999;129:2109–2112. doi: 10.1093/jn/129.12.2109. - DOI - PubMed

LinkOut - more resources