

Low-Cost Microalgae Cell Concentration Estimation in Hydrochemistry Applications Using Computer Vision
- PMID: 40807815
- PMCID: PMC12349023
- DOI: 10.3390/s25154651
Low-Cost Microalgae Cell Concentration Estimation in Hydrochemistry Applications Using Computer Vision
Abstract
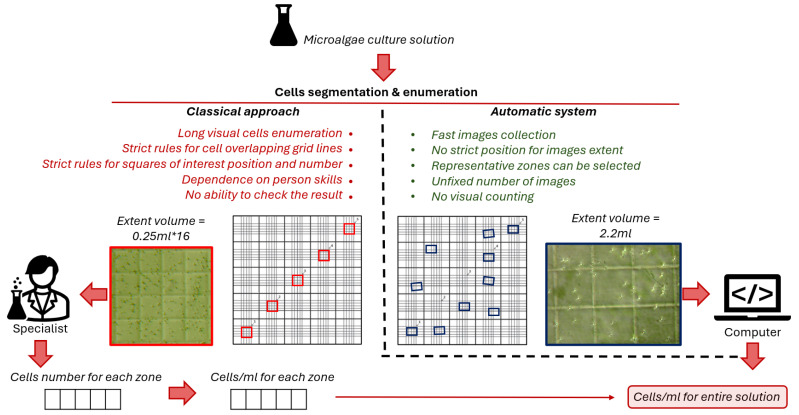
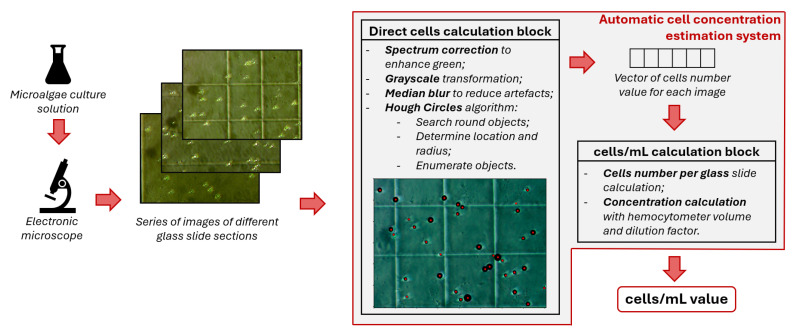
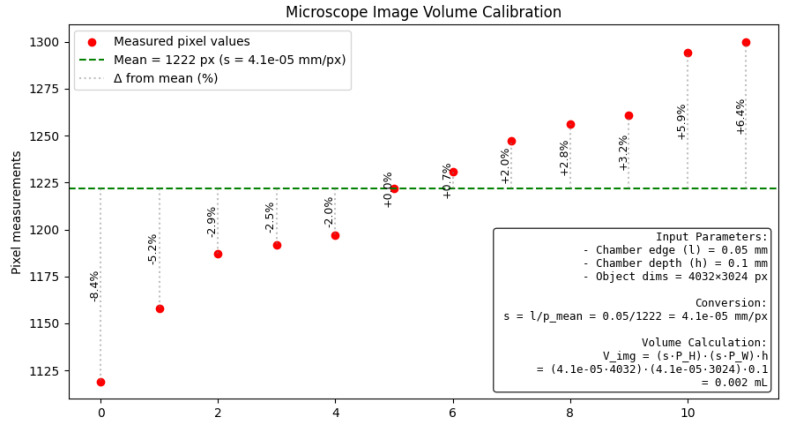
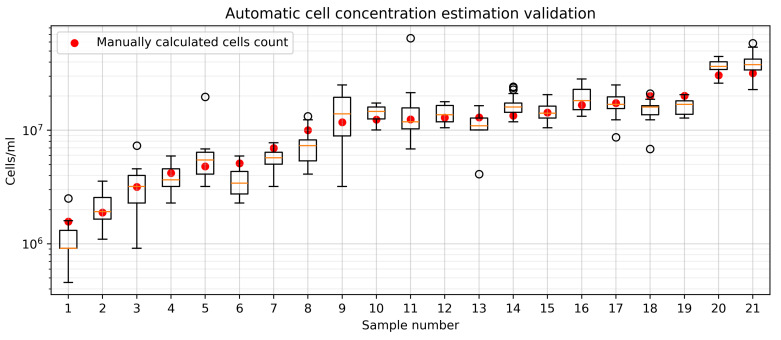
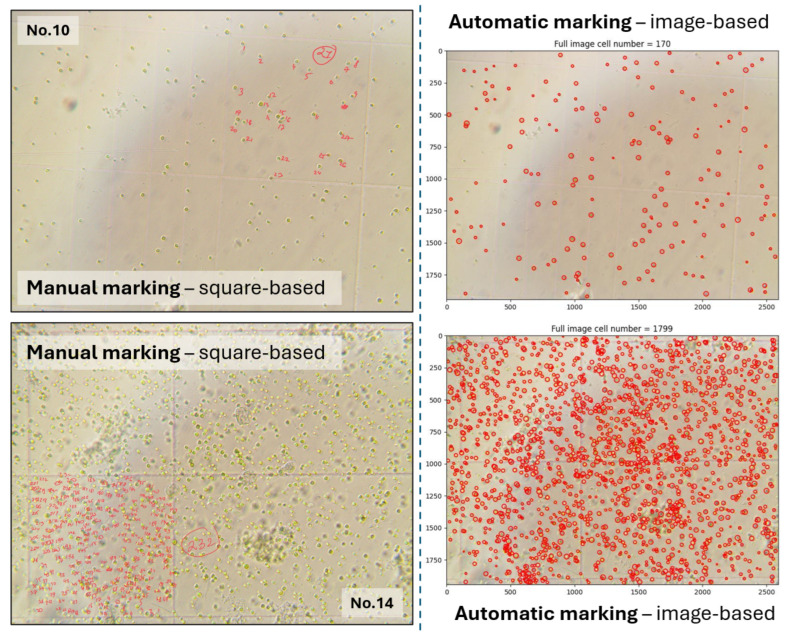
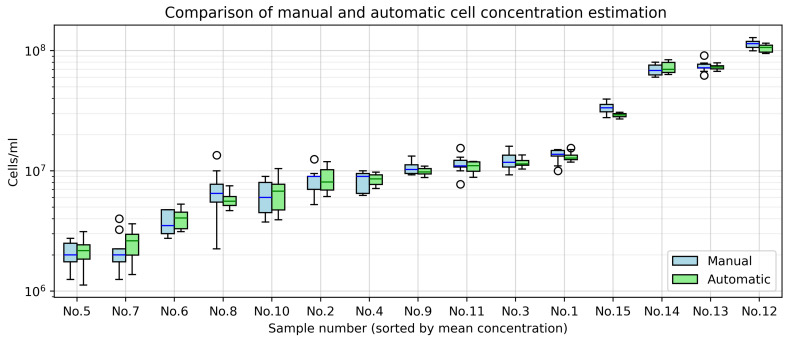
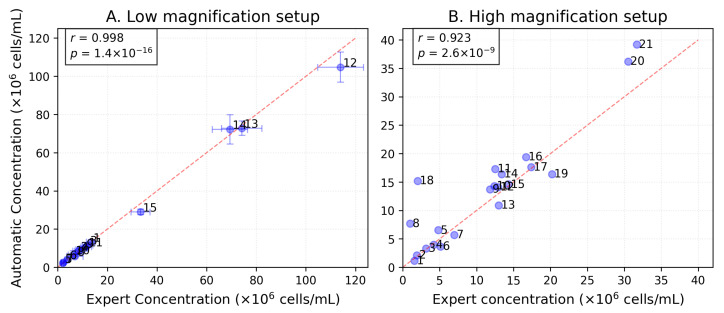
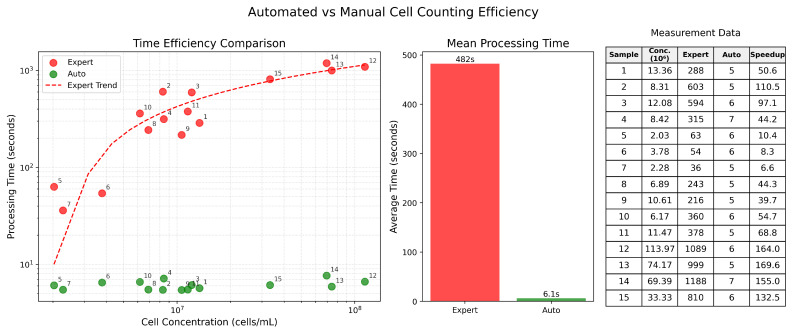
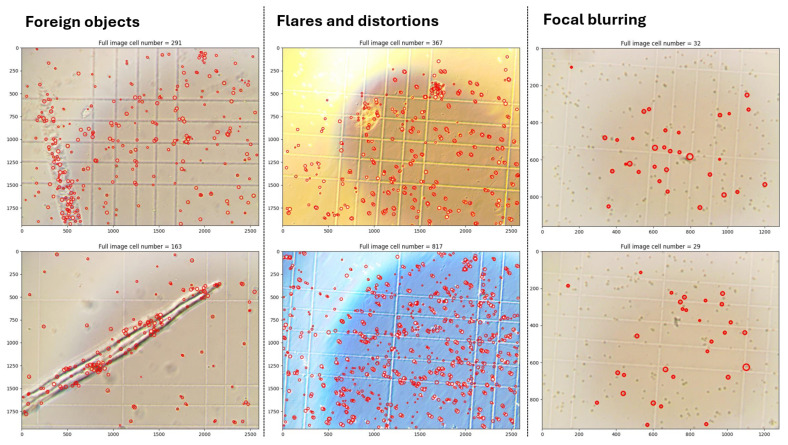
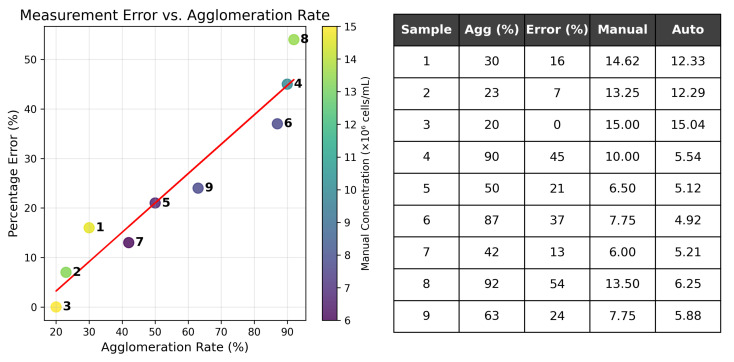
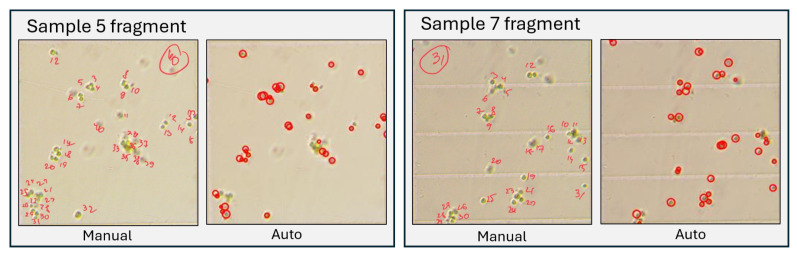
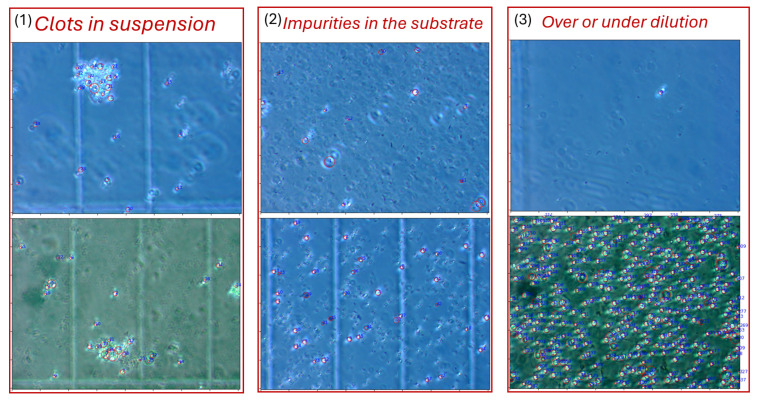
Accurate and efficient estimation of microalgae cell concentration is critical for applications in hydrochemical monitoring, biofuel production, pharmaceuticals, and ecological studies. Traditional methods, such as manual counting with a hemocytometer, are time-consuming and prone to human error, while automated systems are often costly and require extensive training data. This paper presents a low-cost, automated approach for estimating cell concentration in Chlorella vulgaris suspensions using classical computer vision techniques. The proposed method eliminates the need for deep learning by leveraging the Hough circle transform to detect and count cells in microscope images, combined with a conversion factor to translate pixel measurements into metric units for direct concentration calculation (cells/mL). Validation against manual hemocytometer counts demonstrated strong agreement, with a Pearson correlation coefficient of 0.96 and a mean percentage difference of 17.96%. The system achieves rapid processing (under 30 s per image) and offers interpretability, allowing specialists to verify results visually. Key advantages include affordability, minimal hardware requirements, and adaptability to other microbiological applications. Limitations, such as sensitivity to cell clumping and impurities, are discussed. This work provides a practical, accessible solution for laboratories lacking expensive automated equipment, bridging the gap between manual methods and high-end technologies.
Keywords: cell concentration; cell segmentation; computer vision; microalgae; microscopy.
Conflict of interest statement
The authors declare no conflicts of interest. The funders had no role in the design of the study; in the collection, analyses, or interpretation of data; in the writing of the manuscript; or in the decision to publish the results.
Figures
Similar articles
-
Prescription of Controlled Substances: Benefits and Risks.2025 Jul 6. In: StatPearls [Internet]. Treasure Island (FL): StatPearls Publishing; 2025 Jan–. 2025 Jul 6. In: StatPearls [Internet]. Treasure Island (FL): StatPearls Publishing; 2025 Jan–. PMID: 30726003 Free Books & Documents.
-
Leveraging a foundation model zoo for cell similarity search in oncological microscopy across devices.Front Oncol. 2025 Jun 18;15:1480384. doi: 10.3389/fonc.2025.1480384. eCollection 2025. Front Oncol. 2025. PMID: 40606969 Free PMC article.
-
Management of urinary stones by experts in stone disease (ESD 2025).Arch Ital Urol Androl. 2025 Jun 30;97(2):14085. doi: 10.4081/aiua.2025.14085. Epub 2025 Jun 30. Arch Ital Urol Androl. 2025. PMID: 40583613 Review.
-
Automated devices for identifying peripheral arterial disease in people with leg ulceration: an evidence synthesis and cost-effectiveness analysis.Health Technol Assess. 2024 Aug;28(37):1-158. doi: 10.3310/TWCG3912. Health Technol Assess. 2024. PMID: 39186036 Free PMC article.
-
Variation within and between digital pathology and light microscopy for the diagnosis of histopathology slides: blinded crossover comparison study.Health Technol Assess. 2025 Jul;29(30):1-75. doi: 10.3310/SPLK4325. Health Technol Assess. 2025. PMID: 40654002 Free PMC article.
References
-
- Zhang J., Li C., Rahaman M.M., Yao Y., Ma P., Zhang J., Zhao X., Jiang T., Grzegorzek M. A comprehensive review of image analysis methods for microorganism counting: From classical image processing to deep learning approaches. Artif. Intell. Rev. 2022;55:2875–2944. doi: 10.1007/s10462-021-10082-4. - DOI - PMC - PubMed
-
- Safi C., Zebib B., Merah O., Pontalier P.Y., Vaca-Garcia C. Morphology, composition, production, processing and applications of Chlorella vulgaris: A review. Renew. Sustain. Energy Rev. 2014;35:265–278. doi: 10.1016/j.rser.2014.04.007. - DOI
-
- San Cha T., Chee J.Y., Loh S.H., Jusoh M. Oil production and fatty acid composition of Chlorella vulgaris cultured in nutrient-enriched solid-agar-based medium. Bioresour. Technol. Rep. 2018;3:218–223.
-
- Brennan L., Owende P. Biofuels from microalgae—A review of technologies for production, processing, and extractions of biofuels and co-products. Renew. Sustain. Energy Rev. 2010;14:557–577. doi: 10.1016/j.rser.2009.10.009. - DOI
-
- Sano T., Tanaka Y. Effect of dried, powdered Chlorella vulgaris on experimental atherosclerosis and alimentary hypercholesterolemia in cholesterol-fed rabbits. Artery. 1987;14:76–84. - PubMed
LinkOut - more resources
Full Text Sources
Miscellaneous
