

Noninvasive Mapping of Extracellular Potassium in Breast Tumors via Multi-Wavelength Photoacoustic Imaging
- PMID: 40807890
- PMCID: PMC12349659
- DOI: 10.3390/s25154724
Noninvasive Mapping of Extracellular Potassium in Breast Tumors via Multi-Wavelength Photoacoustic Imaging
Abstract
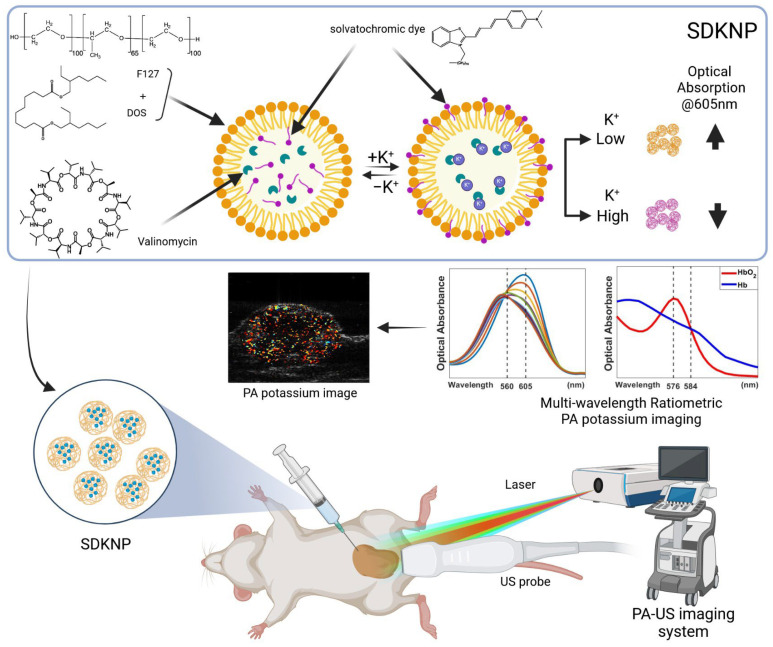
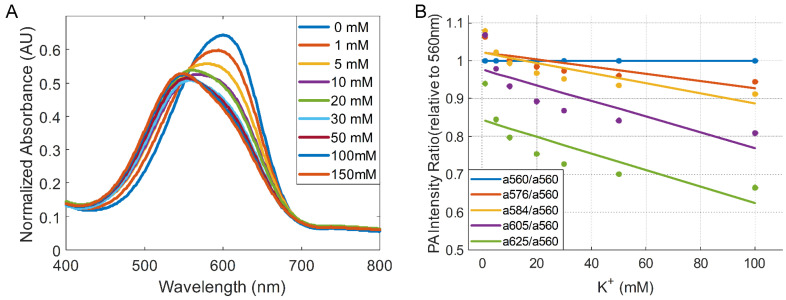
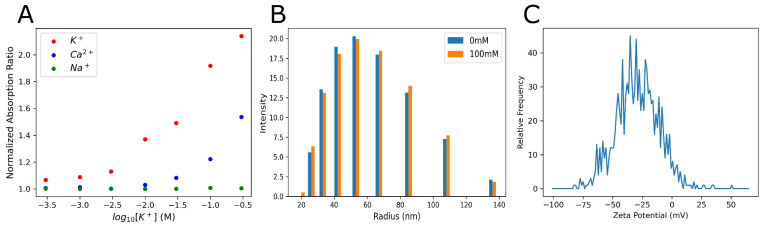
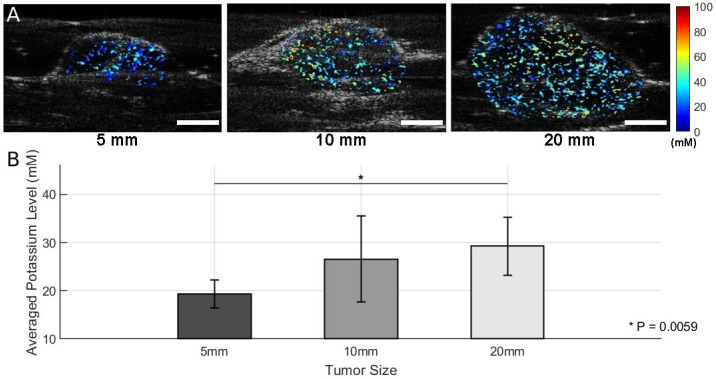
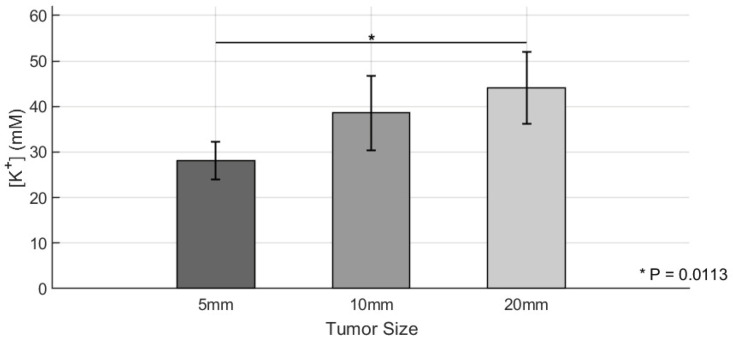
Elevated extracellular potassium (K+) in the tumor microenvironment (TME) of breast and other cancers is increasingly recognized as a critical factor influencing tumor progression and immune suppression. Current methods for noninvasive mapping of the potassium distribution in tumors are limited. Here, we employed photoacoustic chemical imaging (PACI) with a solvatochromic dye-based, potassium-sensitive nanoprobe (SDKNP) to quantitatively visualize extracellular potassium levels in an orthotopic metaplastic breast cancer mouse model, Ccn6-KO. Tumors of three distinct sizes (5 mm, 10 mm, and 20 mm) were imaged using multi-wavelength photoacoustic imaging at five laser wavelengths (560, 576, 584, 605, and 625 nm). Potassium concentration maps derived from spectral unmixing of the photoacoustic images at the five laser wavelengths revealed significantly increased potassium levels in larger tumors, confirmed independently by inductively coupled plasma mass spectrometry (ICP-MS). The PACI results matched ICP-MS measurements, validating PACI as a robust, noninvasive imaging modality for potassium mapping in tumors in vivo. This work establishes PACI as a promising tool for studying the chemical properties of the TME and provides a foundation for future studies evaluating the immunotherapy response through ionic biomarker imaging.
Keywords: CCN6; breast cancer; chemical imaging; metaplastic breast carcinoma; nanoparticle; photoacoustic; potassium.
Conflict of interest statement
The authors declare no conflicts of interest.
Figures
Similar articles
-
Tumor therapy by targeting extracellular hydroxyapatite using novel drugs: A paradigm shift.Cancer Med. 2024 Feb;13(3):e6812. doi: 10.1002/cam4.6812. Epub 2024 Jan 18. Cancer Med. 2024. PMID: 38239047 Free PMC article.
-
Interplay between tumor mutation burden and the tumor microenvironment predicts the prognosis of pan-cancer anti-PD-1/PD-L1 therapy.Front Immunol. 2025 Jul 24;16:1557461. doi: 10.3389/fimmu.2025.1557461. eCollection 2025. Front Immunol. 2025. PMID: 40777041 Free PMC article.
-
Prescription of Controlled Substances: Benefits and Risks.2025 Jul 6. In: StatPearls [Internet]. Treasure Island (FL): StatPearls Publishing; 2025 Jan–. 2025 Jul 6. In: StatPearls [Internet]. Treasure Island (FL): StatPearls Publishing; 2025 Jan–. PMID: 30726003 Free Books & Documents.
-
Positron emission tomography (PET) and magnetic resonance imaging (MRI) for the assessment of axillary lymph node metastases in early breast cancer: systematic review and economic evaluation.Health Technol Assess. 2011 Jan;15(4):iii-iv, 1-134. doi: 10.3310/hta15040. Health Technol Assess. 2011. PMID: 21276372 Free PMC article.
-
Cost-effectiveness of using prognostic information to select women with breast cancer for adjuvant systemic therapy.Health Technol Assess. 2006 Sep;10(34):iii-iv, ix-xi, 1-204. doi: 10.3310/hta10340. Health Technol Assess. 2006. PMID: 16959170
References
Grants and funding
LinkOut - more resources
Full Text Sources
Research Materials
