

A Semi-Automated RGB-Based Method for Wildlife Crop Damage Detection Using QGIS-Integrated UAV Workflow
- PMID: 40807897
- PMCID: PMC12349311
- DOI: 10.3390/s25154734
A Semi-Automated RGB-Based Method for Wildlife Crop Damage Detection Using QGIS-Integrated UAV Workflow
Abstract
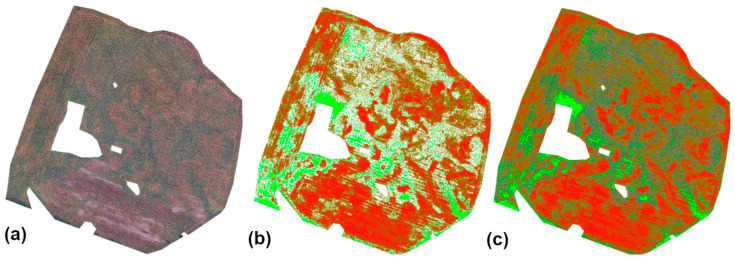
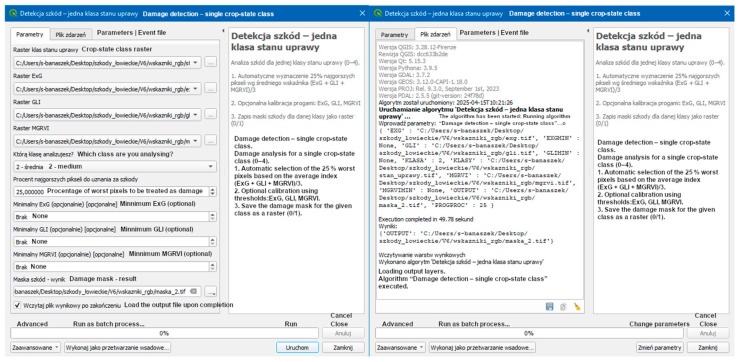
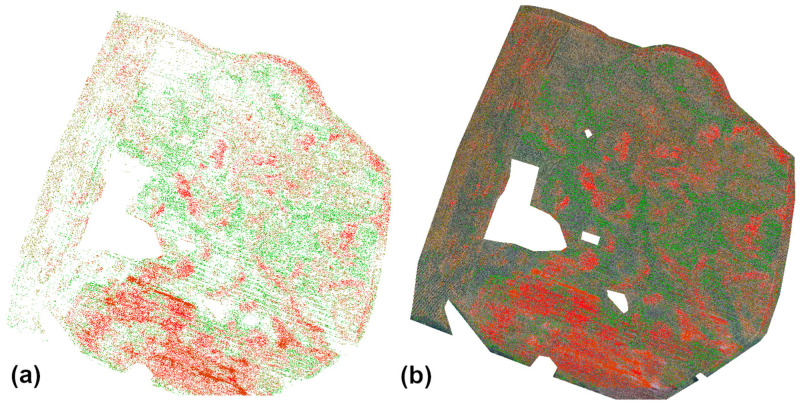
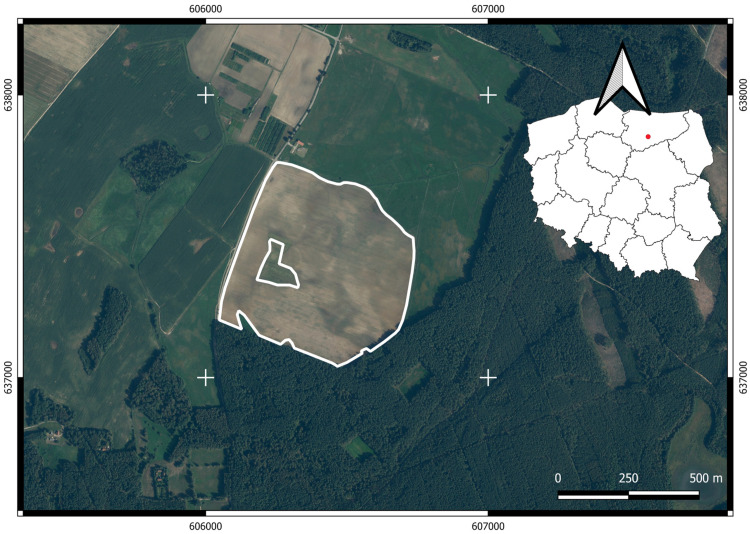
Monitoring crop damage caused by wildlife remains a significant challenge in agricultural management, particularly in the case of large-scale monocultures such as maize. The given study presents a semi-automated process for detecting wildlife-induced damage using RGB imagery acquired from unmanned aerial vehicles (UAVs). The method is designed for non-specialist users and is fully integrated within the QGIS platform. The proposed approach involves calculating three vegetation indices-Excess Green (ExG), Green Leaf Index (GLI), and Modified Green-Red Vegetation Index (MGRVI)-based on a standardized orthomosaic generated from RGB images collected via UAV. Subsequently, an unsupervised k-means clustering algorithm was applied to divide the field into five vegetation vigor classes. Within each class, 25% of the pixels with the lowest average index values were preliminarily classified as damaged. A dedicated QGIS plugin enables drone data analysts (Drone Data Analysts-DDAs) to adjust index thresholds, based on visual interpretation, interactively. The method was validated on a 50-hectare maize field, where 7 hectares of damage (15% of the area) were identified. The results indicate a high level of agreement between the automated and manual classifications, with an overall accuracy of 81%. The highest concentration of damage occurred in the "moderate" and "low" vigor zones. Final products included vigor classification maps, binary damage masks, and summary reports in HTML and DOCX formats with visualizations and statistical data. The results confirm the effectiveness and scalability of the proposed RGB-based procedure for crop damage assessment. The method offers a repeatable, cost-effective, and field-operable alternative to multispectral or AI-based approaches, making it suitable for integration with precision agriculture practices and wildlife population management.
Keywords: QGIS; RGB; UAV; crop damage; vegetation indices.
Conflict of interest statement
The authors declare no conflicts of interest.
Figures


Similar articles
-
Characterization of Hazelnut Trees in Open Field Through High-Resolution UAV-Based Imagery and Vegetation Indices.Sensors (Basel). 2025 Jan 6;25(1):288. doi: 10.3390/s25010288. Sensors (Basel). 2025. PMID: 39797079 Free PMC article.
-
Remote sensing for precision weed management.Pest Manag Sci. 2025 Aug;81(8):4190-4199. doi: 10.1002/ps.8833. Epub 2025 Apr 17. Pest Manag Sci. 2025. PMID: 40247610 Review.
-
Detection of weeds in teff crops using deep learning and UAV imagery for precision herbicide application.Sci Rep. 2025 Aug 21;15(1):30708. doi: 10.1038/s41598-025-15380-3. Sci Rep. 2025. PMID: 40841734 Free PMC article.
-
Prescription of Controlled Substances: Benefits and Risks.2025 Jul 6. In: StatPearls [Internet]. Treasure Island (FL): StatPearls Publishing; 2025 Jan–. 2025 Jul 6. In: StatPearls [Internet]. Treasure Island (FL): StatPearls Publishing; 2025 Jan–. PMID: 30726003 Free Books & Documents.
-
Automated devices for identifying peripheral arterial disease in people with leg ulceration: an evidence synthesis and cost-effectiveness analysis.Health Technol Assess. 2024 Aug;28(37):1-158. doi: 10.3310/TWCG3912. Health Technol Assess. 2024. PMID: 39186036 Free PMC article.
References
-
- Amici A., Serrani F., Rossi C.M., Primi R., Santilli F., Boitani L. Increase in Crop Damage Caused by Wild Boar (Sus scrofa L.): The “Refuge Effect”. Agron. Sustain. Dev. 2012;32:683–692. doi: 10.1007/s13593-011-0057-6. - DOI
-
- Hegel C.G.Z., Faria G.M.M., Ribeiro B., Salvador C.H., Rosa C., Pedrosa F., Batista G., Sales L.P., Wallau M., Fornel R., et al. Invasion and spatial distribution of wild pigs (Sus scrofa L.) in Brazil. Biol. Invasions. 2022;24:3681–3692. doi: 10.1007/s10530-022-02872-w. - DOI
-
- Smith J.L., Lowe R.C., Conner L.M., Mengak M.T. Quantifying Wild Pig (Sus scrofa) Damage to Corn, Cotton, and Peanut Fields Using Unmanned Aerial Systems in Southwestern Georgia, USA. Crop Prot. 2025;175:107233. doi: 10.1016/j.cropro.2025.107233. - DOI
MeSH terms
LinkOut - more resources
Full Text Sources
