

Sub-MHz EMAR for Non-Contact Thickness Measurement: How Ultrasonic Wave Directivity Affects Accuracy
- PMID: 40807913
- PMCID: PMC12349216
- DOI: 10.3390/s25154746
Sub-MHz EMAR for Non-Contact Thickness Measurement: How Ultrasonic Wave Directivity Affects Accuracy
Abstract
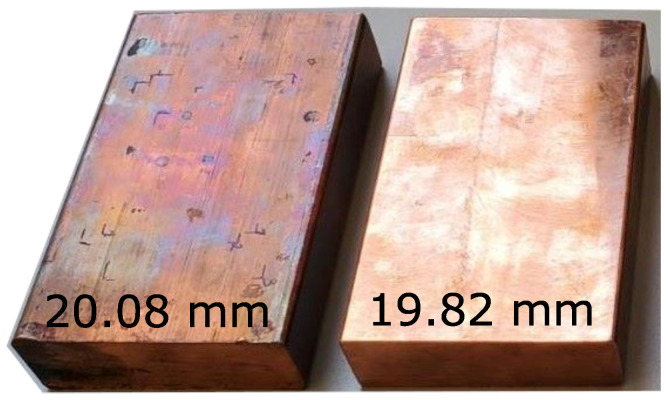
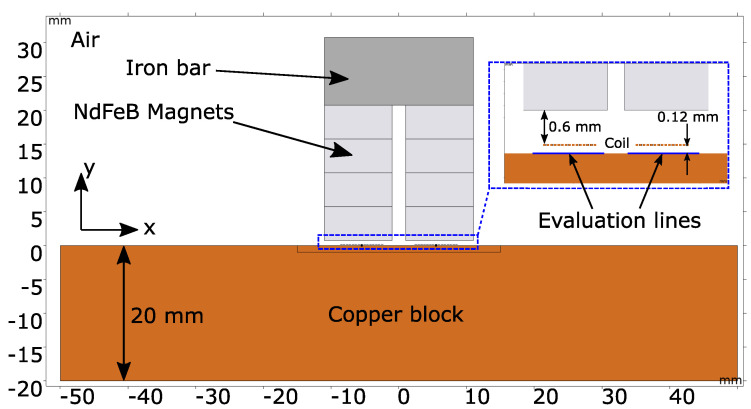
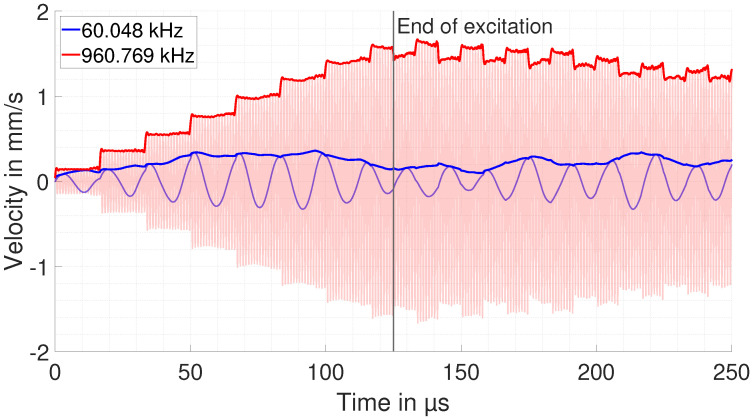
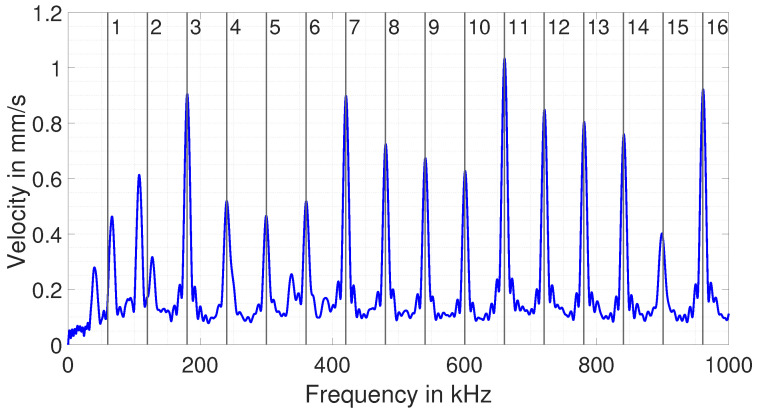
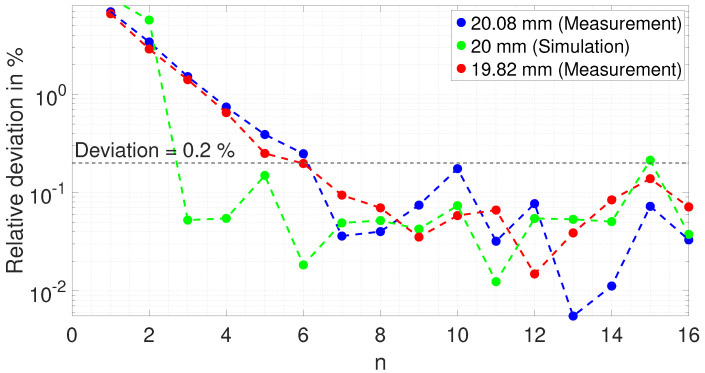
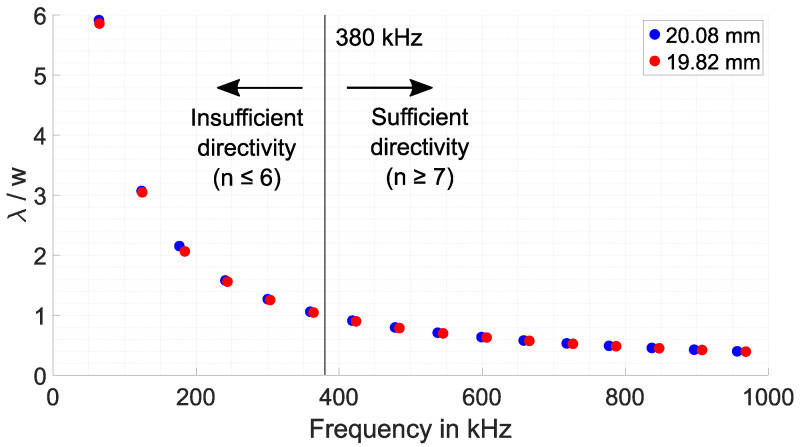
Electromagnetic acoustic resonance (EMAR) is a well-established non-contact method for ultrasonic thickness measurement, typically operated at frequencies above 1 MHz using an electromagnetic acoustic transducer (EMAT). This study successfully extends EMAR into the sub-MHz range, allowing supply voltages below 60 V and thus offering safer and more cost-effective operation. Experiments were conducted on copper blocks approximately 20 mm thick, where a relative thickness accuracy of better than 0.2% is obtained. Regarding this result, the research identifies a critical design principle: Stable thickness resonances and subsequently accurate thickness measurement are achieved when the ratio of ultrasonic wavelength to EMAT track width (λ/w) falls below 1. This minimizes the excitation and interactions with structural eigenmodes, ensuring consistent measurement reliability. To support this, the study introduces a system-based model to simulate the EMAR method. The model provides detailed insights into how wave propagation affects the accuracy of EMAR measurements. Experimental results align well with the simulation outcome and confirm the feasibility of EMAR in the sub-MHz regime without compromising precision. These findings highlight the potential of low-voltage EMAR as a safer, cost-effective, and highly accurate approach for industrial ultrasonic thickness measurements.
Keywords: EMAR limitations; EMAR simulation; electromagnetic acoustic resonance; electromagnetic acoustic transducer; thickness gauging.
Conflict of interest statement
Authors Andre Hochfellner and Gerald Klösch were employed by the company voestalpine Stahl Donawitz GmbH. The remaining authors declare that the research was conducted in the absence of any commercial or financial relationships that could be construed as a potential conflict of interest.
Figures


Similar articles
-
Prescription of Controlled Substances: Benefits and Risks.2025 Jul 6. In: StatPearls [Internet]. Treasure Island (FL): StatPearls Publishing; 2025 Jan–. 2025 Jul 6. In: StatPearls [Internet]. Treasure Island (FL): StatPearls Publishing; 2025 Jan–. PMID: 30726003 Free Books & Documents.
-
A Novel Design of a Portable Birdcage via Meander Line Antenna (MLA) to Lower Beta Amyloid (Aβ) in Alzheimer's Disease.IEEE J Transl Eng Health Med. 2025 Apr 10;13:158-173. doi: 10.1109/JTEHM.2025.3559693. eCollection 2025. IEEE J Transl Eng Health Med. 2025. PMID: 40657533 Free PMC article.
-
The agreement of phonetic transcriptions between paediatric speech and language therapists transcribing a disordered speech sample.Int J Lang Commun Disord. 2024 Sep-Oct;59(5):1981-1995. doi: 10.1111/1460-6984.13043. Epub 2024 Jun 8. Int J Lang Commun Disord. 2024. PMID: 38850167
-
Maternal and neonatal outcomes of elective induction of labor.Evid Rep Technol Assess (Full Rep). 2009 Mar;(176):1-257. Evid Rep Technol Assess (Full Rep). 2009. PMID: 19408970 Free PMC article.
-
The Lived Experience of Autistic Adults in Employment: A Systematic Search and Synthesis.Autism Adulthood. 2024 Dec 2;6(4):495-509. doi: 10.1089/aut.2022.0114. eCollection 2024 Dec. Autism Adulthood. 2024. PMID: 40018061 Review.
References
-
- Billings J.K. Noncontact ultrasonic gauging for industrial applications. J. Acoust. Soc. Am. 1986;79:S60. doi: 10.1121/1.2023309. - DOI
-
- Chen X., Li J., Wang Z. Inversion Method in Pulsed Eddy Current Testing for Wall Thickness of Ferromagnetic Pipes. IEEE Trans. Instrum. Meas. 2020;69:9766–9773. doi: 10.1109/TIM.2020.3005114. - DOI
-
- Heinlein S., Mariani S., Milewczyk J., Vogt T., Cawley P. Improved thickness measurement on rough surfaces by using guided wave cut-off frequency. NDT E Int. 2022;132:102713. doi: 10.1016/j.ndteint.2022.102713. - DOI
-
- Kumar N.P., Patankar V., Kulkarni M. Ultrasonic Gauging and Imaging of Metallic Tubes and Pipes: A Review. International Atomic Energy Agency (IAEA); Vienna, Austria: 2020.
-
- Li F., Bell A., Damjanovic D., Jo W., Ye Z.G., Zhang S. Recent Advances in Piezoelectric Materials for Electromechanical Transducer Applications. IEEE Trans. Ultrason. Ferroelectr. Freq. Control. 2022;69:2999–3002. doi: 10.1109/TUFFC.2022.3215791. - DOI
LinkOut - more resources
Full Text Sources
