Review
. 2025 Jul 27;17(15):2047.
doi: 10.3390/polym17152047.

The Advances in Polymer-Based Electrothermal Composites: A Review

Affiliations
Review

The Advances in Polymer-Based Electrothermal Composites: A Review

Xiaoli Wu et al. Polymers (Basel). .

Abstract

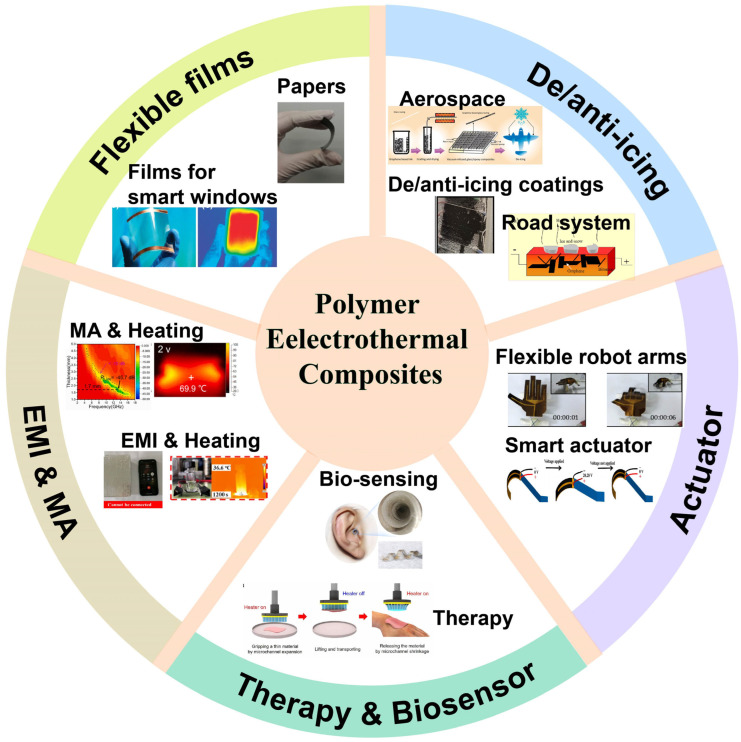
Polymer-based electrothermal composites (PECs) have been increasingly attracting attention in recent years owing to their flexibility, low density, and high electrothermal efficiency. However, although a large number of reviews have focused on flexible and transparent film heaters as well as polymer-based conductive composites, comprehensive reviews of polymer-based electrothermal composites remain limited. Herein, we provide a comprehensive review of recent advancements in polymer-based electrothermal materials. This review begins with an introduction to the electrothermal theoretical basis and the research progress of PECs incorporating various conductive fillers, such as graphene, carbon nanotubes (CNTs), carbon black (CB), MXenes, and metal nanowires. Furthermore, a critical discussion is provided to emphasize the factors influencing the electrothermal conversion efficiency of these composites. Meanwhile, the development of multi-functional electrothermal materials has been also summarized. Finally, the application progress, future prospects, limitations, and potential directions for PEC are discussed. This review aims to serve as a practical guide for engineers and researchers engaged in the development of polymer-based electrothermal composites.

Keywords: MXene; carbon nanotube; electrothermal conversion efficiency; electrothermal theoretical basis; graphene; polymer-based electrothermal composites.


Conflict of interest statement

The authors declare that they have no known competing financial interests or personal relationships that could have appeared to influence the work reported in this paper.

Figures

Figure 1
Figure 1
The applications of electric heating materials: de-icing/anti-icing [11,12,35], flexible films [6,44], electromagnetic interference (EMI) shielding [19] and microwave absorption (MA) [21], electric heating actuators [17,45], and physical therapy and medical monitoring [18,46].
Figure 2
Figure 2
The preparation methods for polymer-based electrothermal materials: (A) CVD + roll–roll process [6], (B) solution mixing [24], (C) solution mixing + spin-coating [41], (D) dip-coating [34], (E) self-assembly process [10], (F) spray-coating [14], (G) CVD + infiltration process [43].
Figure 3
Figure 3
(A): (a) A schematic structure (i), an optical picture (ii), and infrared picture (iii) of a transparent, flexible graphene heater film [6]. (b) The temperature profiles of graphene-based heaters with two different doping agents and an ITO-based heater, measured by (i) an infrared scanner and (ii) a thermocouple (K-type) [6]. (c) Mechanical stability of the graphene-based heater including (i) variations in the temperature of a graphene-based heater compared with an ITO-based heater as a function of bending strain and (ii) mechanical stability test results of the graphene-based heater [6]. (B): The surface (i–iii) and cross-sectional (iv–vi) SEM images of the electrothermal films in different magnifications [36]. (C): (a) SEM images of epoxy coating doped with 10 wt% GNP over a laminate substrate, where (i) shows a lateral cross-section and (ii) shows the surface morphology [12]. (b) Electrical power and the maximum increase in temperature reached by the application of 800 V at room temperature [12]. (c) (i) Increase in temperature as a function of time and (ii) thermal images for increasing GNP wt.%, specifically 8 wt.% (8G), 10 wt.% (10G), and 12 wt.% (12G) [12].
Figure 4
Figure 4
(A): (a) Schematic illustrations of the self-developed fabrication process for PVA/CNTs film: (i) Schematic diagram of CNTs dispersion and corresponding optical image; (ii) Spraying method for pre-constructing CNT network on polycarbonate surface; (iii) quantitative spinning process to introduce ultrathin PVA layer; (iv) hot pressing treatment to prepare PVA/CNTs film [42]. (b) (i,ii) Thermal images of PVA/CNTs heater affixed on hand in different states; (iii,iv) the defrosting result of PVA/CNTs heater before and after the heating process; (v, vi) reversible thermochromism is also observed in a dyed film. [42]. (B): (a) (i–iii) SEM images of MWCNT layers prepared by different cycle numbers (2, 4, and 6) of spin-coating on glass plates; (iv) change of average thickness of MWCNT layers as a function of the cycle number of spin-coating and a typical SEM image of cross-section of MWCNT layer formed by 7 cycles of spin-coating on a glass plate [41]. (b) SEM images of surface (i) and cross-section (ii) of MWCNT108/PDMS bilayer film with 108 nm thickness of the MWCNT layers; (iii) optical image of MWCNT108/PDMS bilayer film; (iv) transmittance of MWCNT/PDMS bilayer films with different MWCNT layer thicknesses [41]. (C): (a) (i) Typical digital and (ii) infrared images for the paper crane made of M-1 paper under an applied voltage (M-x, where x denotes the cycle number of dip-coating processes) [34]. (b) Changes in steady-state maximum temperature (Tmax) of MWCNT/cellulose papers as a function of the applied voltage [34]. (D): (a) (i) Scanning electron microscopy (SEM) image of MWCNT sheets from well-aligned MWCNTs on a substrate and (ii) the diagram of MWCNT sheet film on a substrate with an electrode pair [76]. (b) (i) Sheet temperatures plotted versus length/width at different DC voltages, and (ii) sheet temperature plotted versus applied DC power to sheet film for each length-to-width ratio [76].
Figure 5
Figure 5
(A): (a) SEM images of the surface of PANF/SCB films with 23 and 28.5 wt.% SCBs at ×3000 (i,ii) and ×20000 (iii,iv) magnification, respectively. The inset shows digital images of PANF/SCB films [24]. (bg) Electric heating performance of HA-PANF/SCB films with different PANF/SCB mass ratios [24]. (B): (a) (i) Raman spectrogram of GNSs in different layers, (ii) Thermal gravimetric analysis and Differential Thermal Analysis results of 3D intercalation GNS/MWCNT/CB composite, and (iii) schematic diagram of CNTs and CB intercalated in GNS [87]. (b) (i) Electrothermal performance of the flexible electrothermal film under different voltages; (ii) performance of the flexible electrothermal film with continuously changing voltage; (iii, iv) performance and the stability test of the flexible electrothermal film in air [87].
Figure 6
Figure 6
(A): Schematic illustration for the fabrication of flexible conductive PIF/MXene composite films [20]. (B): (a) Time-dependent surface temperature profile of PM-49.1 under different voltages [20]. (b) Experimental data and linear fitting of saturated temperature vs. U2 [20].
Figure 7
Figure 7
(A): (a)Schematic illustration of the preparation process of superhydrophobic and electrically conductive TPU/ACNT/AgNP/PDMS nanofiber composites [95]. (b) Photograph of the CNC membrane with good flexibility [95]. (c) Photo showing the resistance of one piece of CNC membrane [95]. SEM image for (d) surface and (e) cross-sectional morphology [95]. (f) TEM image of the CNC membrane [95]. (gk) Element mapping images for C, N, O, Ag, and Si, respectively [95]. (B): (a) Temperature variation of the CNC at different applied voltages. (b) Voltage–current curve of the CNC [95]. (c) Temperature variation of the CNC experiencing cyclic heating–cooling process at a given voltage of 3 V [95]. Water droplet on the CNC surface (d) with a voltage of 3 V and (e) without an applied voltage [95]. De-icing performance of the CNC (f) at a voltage of 3 V and (g) without an applied voltage [95].
Figure 8
Figure 8
(A): (a) (i) I-V measurement and (ii) transmittance of SWCNT-coated glass specimens [116]. (b) (i–iii) Temperature profiles of the SWCNT-coated specimen with resistances of 22.6, 35.8, and 54.6 KΩ, respectively, with respect to the applied voltage. The plot of the derivative of the temperature vs. time is shown in the inset at the applied voltage of 60 V; (iv) average temperature of the specimens at the steady-state with respect to the applied voltage [116]. (B): (a) Response to the heating signal, (b) on and off delays, and (c) power-density–temperature plots of the CNT film on PET for different substrate thicknesses of 70, 127, and 180 μm [49]. (d) Response to the heating signal, (e) on and off delays, and (f) power-density–temperature plots of the CNT film on PET for different CNT film areas of 2 × 2, 6 × 6, and 10 × 10 mm2 [49].
Figure 9
Figure 9
(A) Electrical power density vs. saturated temperature of graphene/glass and Cr thin-film/glass systems [7]. (B) Theoretical radiative heat power loss of two systems as a function of temperature [7]. (C) Convective heat power loss for various presumed convective heat-transfer coefficients with experimentally observed values for graphene (solid circles) and Cr thin-film (open circles) systems [7]. (D) Visualization of convective and radiative heat power loss for both systems [7].
Figure 10
Figure 10
(A): (a) The Relationship between time and temperature at different heat flux densities for the film/paper at the environmental temperature of 22 °C (i), of −32 °C (ii); the relationship between heat flux densities and the equilibrium temperatures at the two analyzed environmental temperatures of 22 °C and −32 °C (iii); enlargement of the first zone of (ii) corresponding to the rectangular area highlighted with the black perimeter (iv) [44]. (b) (i) The relationship between time and temperature at different heat flux densities for the assembled composite during the de-icing process; (ii) increase in the temperature range from −32 °C to 10 °C; (iii) comparison of the normalized de-icing time at different heat flux densities; (iv) comparison of the response times of the assembled composite at different heat flux densities [44]. (B): (a) Schematic of the fabrication process and the heating mode of the samples: (i) The rear-mounted polyimide heating film sample (HF) and (ii) the super-hydrophobic coating combined with electric heating coating (S-EC) [14]. (b) Fluorescence experiment of the ice drops detaching from the coating surfaces: (i) Images of the droplet in freezing process under halogen light and ultraviolet light; (ii) the schematics of the ice drop on S-EC in this test; the momentary fluorescence images of the ice drop before it was exactly blown away on (iii) S-EC and (iv) EC [14]. (c) De-icing properties of the coatings: (i) The schematic of de-icing test; (ii) the de-icing time of HF, EC, and S-EC at different Pd; the initial and the eventual state images of (iii) HF, (iv) EC and (v) S-EC in de-icing test at Pd = 0.7 W/cm2 [14].
Figure 11
Figure 11
(A): (a) Schematic of the fabrication process of hydrophobic transparent PMxF film [122]. (b) (i) Contact angles (CAs) at different pH water solutions and (ii) self-cleaning process of dust on the surface of PMxF film [122]. (c) (i) Tailored surface temperatures of PMxF film under gradient-increasing operation voltages; (ii) the change of PMxF film temperature with time under different supplied voltages; (iii) linear fitting of experimental data and saturation temperature with U2 (inset: temperature versus applied power density curve) [122]. (d) EMI shielding performance at (i) X-band and (ii) K-band for PMxF film; (iii) corresponding EMI shielding performance before and after bending for 1000 cycles [122]. (B): (a) Schematic illustration of the formation process of CC@ZnO matrix and CAP composites [21]. (b) (i) Operating temperature vs time of ceramic heating plate; (ii) as-obtained flexible films; (iii) schematic illustration of thermal management components [21]. (c) Temperature curves under different operation voltages and corresponding infrared camera images of CC@ZnO/AgNWs/PVA composites with (i) 0 wt.%, (ii) 2.5 wt.%, (iii) 5 wt.%, (iv) 10 wt.% of AgNWs proportions in the solution. (d) (i,iii,v) RL values of CC@ZnO composites with of different polyvinylpyrrolidone molecular weights; (ii) RLmin and (iv) effective absorption bandwidth values of CC@ZnO samples, (vi) the related broadband of CC@ZnO samples at different thicknesses [21].
Figure 12
Figure 12
(A): (a) (i) Schematic illustration of the bending mechanism of GN/PI bi-layers due to their different thermal expansion coefficients; (ii) initial (room temperature) state and (iii) heated bending state of the GN/PI bi-layers; (iv) design structure of the GN-Fingers; (v) initial state of the GN-Fingers; (vi) bending state of the GN-Fingers under a driving voltage of 10 V, (vii,viii) Photos of the flexible GN/PI bi-layer films; (ix) photos of the soft GN-Fingers taken after the first (inset) and 100 cycles of actuation under 12.5 V; (x) bending angle of 100 cycles recorded on the as-prepared GN-Fingers [45]. (b) (i–iv) Images of different bending states and (v–ix) IR images of the soft GN-Fingers with the driving voltage of 12.5 V; (x) temperature of the soft GN-Finger under various driving voltages of 8.5 V, 10.5 V, and 12.5 V, also shown is four temperature cycles driven by 12.5 V; (xi) corresponding plot of the bending angle change versus time [45]. (B): (a) Diagram of the double-layer ETA: (i) Compose graphite paper and PI to fabricate flexible double-layer ETA; (ii) three specifications of graphite paper of sample A, B, C; (iii) bending the flexible actuator by hand; (iv) the bend process of actuator of sample C when power on at 6 V. [15]. (b) The gripping process of the smart robot: (i) stop at the initial position (ii) move to the designated location (iii) power on and clamp (iv) lift and move (v) back to the initial position (vi) power off and release [15].

Similar articles

References

    1. Chuang D.D.L. Self-heating structural materials. Smart Mater. Struct. 2004;13:562. doi: 10.1088/0964-1726/13/3/015. - DOI
    1. Deng H., Lin L., Ji M., Zhang S., Yang M. QF Progress on the morphological control of conductive network in conductive polymer composites and the use as electroactive multifunctional materials. Prog. Polym. Sci. 2014;39:627–655. doi: 10.1016/j.progpolymsci.2013.07.007. - DOI
    1. Sui D., Huang Y., Huang L., Liang J., Ma Y., Chen Y. Flexible and transparent electrothermal film heaters based on graphene materials. Small. 2011;7:3186–3192. doi: 10.1002/smll.201101305. - DOI - PubMed
    1. An J.E., Jeong Y.G. Structure and electric heating performance of graphene/epoxy composite films. Eur. Polym. J. 2013;49:1322–1330. doi: 10.1016/j.eurpolymj.2013.02.005. - DOI
    1. Zeng Z., Jin H., Zhang L., Zhang H., Chen Z., Gao F., Zhang Z. Low-voltage and high-performance electrothermal actuator based on multi-walled carbon nanotube/polymer composites. Carbon. 2015;84:327–334. doi: 10.1016/j.carbon.2014.12.012. - DOI

LinkOut - more resources