. 2025 Aug 11;53(15):gkaf774.
doi: 10.1093/nar/gkaf774.

PIRT-Seq: a high-resolution whole-genome assay to identify protein-coding genes

Affiliations

PIRT-Seq: a high-resolution whole-genome assay to identify protein-coding genes

Emily C A Goodall et al. Nucleic Acids Res. .

Abstract

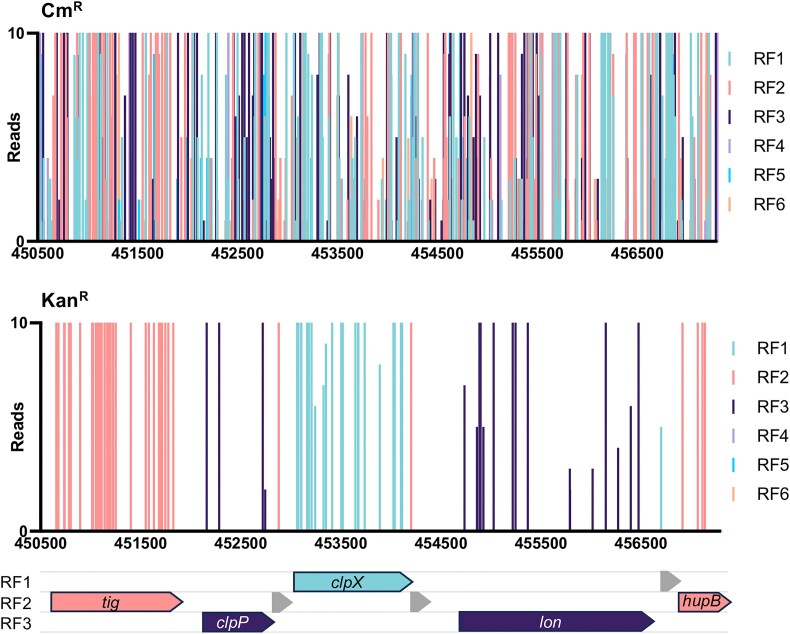
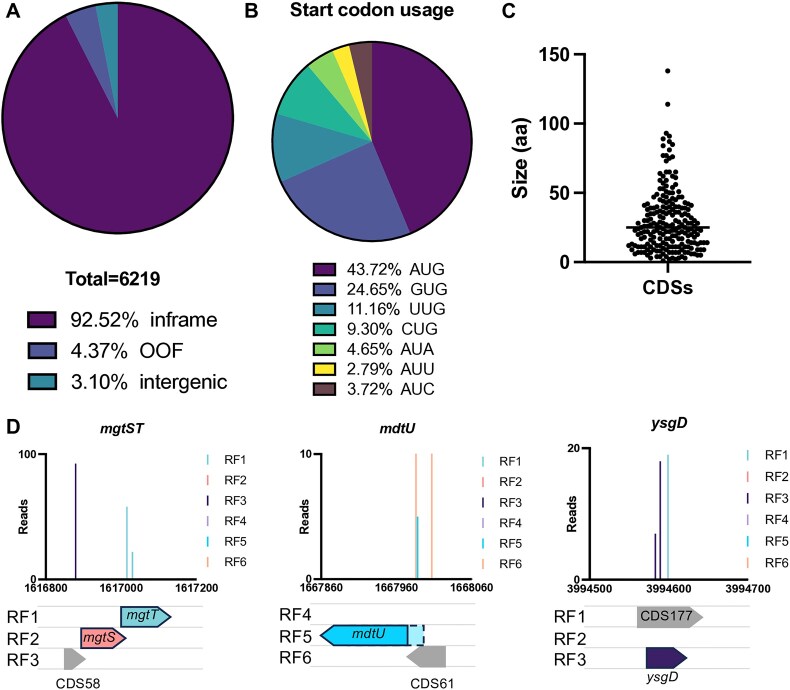
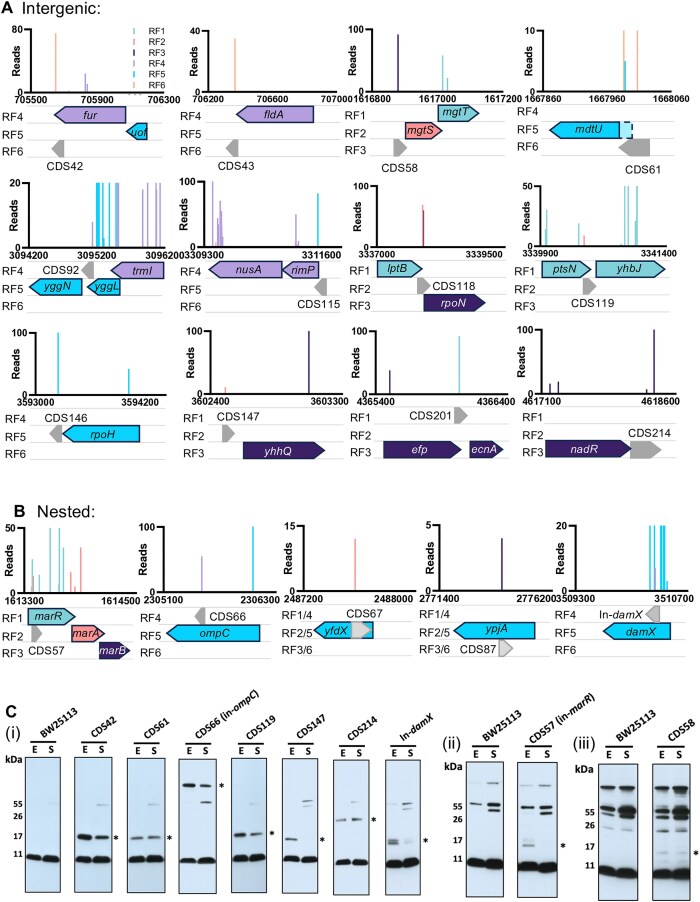
The advent of high-density mutagenesis and data-mining studies suggest the existence of further coding potential within bacterial genomes. Small or overlapping genes are prevalent across all domains of life but are often overlooked for annotation and function because of challenges in their detection. To overcome limitations in existing protein detection methods, we applied a genetics-based approach. We combined transposon insertion sequencing using a dual-selection transposon with a translation reporter to identify translated open reading frames throughout the genome at scale but independent of genome annotation. We applied our method to the well-characterised species Escherichia coli. This method revealed over 200 putative novel protein coding sequences (CDS). These are mostly short CDSs (<50 amino acids) and include proteins that are highly conserved and neighbour functionally important genes. Using chromosomal tags, we validated the expression of selected CDSs. We present this method (Protein Identification through Reporter Transposon-Sequencing: PIRT-Seq) as a complementary method to whole cell proteomics and ribosome trapping for condition-dependent identification of protein CDSs, and as a high-throughput method for testing conditional gene expression. We anticipate this technique will be a starting point for future high-throughput genetics investigations to determine the existence of unannotated genes in multiple bacterial species.


Conflict of interest statement

None declared.

Figures

Graphical Abstract
Graphical Abstract
Figure 1.
Figure 1.
Method overview. [1] Construction of a transposon mutant library via introduction of a transposon with a dual selection mechanism. Successful transformants are isolated via selection on LB agar supplemented with chloramphenicol. [2] Screening of the transposon library on LB agar supplemented with kanamycin selects for mutants that contain a transposon inserted in-frame within an expressed protein coding sequence. [3] Sequencing of the input and output transposon mutant pools reveals translation-fusion mutants that resulted in the expression of the kanamycin resistance cassette, and therefore identifies protein coding sequences. Known, annotated genes (gene A) are indicated by a closed line arrow, while unannotated genes (gene X) are represented with a dashed line arrow, to demonstrate how the insertion data can reveal new genes.
Figure 2.
Figure 2.
The bp resolution of the translation reporter reveals the reading frame of protein coding sequences. The initial construction of the transposon library was selected on agar plates supplemented with chloramphenicol (top panel). The vertical bars represent both the frequency and position of identified transposon insertion sites. The data are coloured according to the reading frame (RF) at the site of insertion. A secondary selection on agar plates supplemented with kanamycin selected for mutants where the transposon is inserted in frame of a protein coding sequence. The data are coloured according to the reading frame at the point of insertion and are consistent with the annotated genes (bottom panel). Annotated genes are indicated by filled arrows with gene names while putative new protein coding genes are indicated by grey arrows.
Figure 3.
Figure 3.
Identification of protein coding sequences. (A) The identified transposon-insertion site (and therefore translation fusion junction) was mapped to the reference genome and cross-references with annotation information. Around 92.52% of insertions were within annotated genes and ‘inframe’ consistent with the reading frame of the annotated gene. Around 4.37% of insertions were within annotated genes but in a different reading frame to the annotated gene OOF and 3.10% of insertions were not within annotated protein coding sequences. (B) The start codon frequency of 215 putative CDSs, and (C) the CDS sizes in amino acids, with the median shown by a horizontal line. (D) Small CDSs identified by reporter TIS neighbouring small genes identified by Ribo-Ret[41]. The transposon insertion sites are those identified following selection with kanamycin (representing translation-fusion events) and are coloured according to the reading frame (RF) at the site of translation-fusion. Putative new genes are shown in grey, labelled 'CDS' accordingly.
Figure 4.
Figure 4.
Validation of new proteins. The genetic neighbourhoods of putative (A) intergenic and (B) nested protein coding sequences (CDS) identified by reporter transposon-insertion sequencing selected for validation. Putative CDSs are shown in grey and labelled 'CDS' accordingly. The insertion data are coloured according to the reading frame (RF) at the site of insertion to highlight the ORF where translation was detected. (C) Representative western blots (of 3 repeats): whole cell lysates probed with anti-FLAG antibody, detected proteins are indicated by *. BW = BW25113 control (untagged); E = Exponential phase; S = Stationary phase. Blots are separated into three panels according to the exposure time used for protein detection (i) short (ii) medium (iii) overnight.
Figure 5.
Figure 5.
CDS carriage within the 227 873 genome database. tblastn results of CDS homologs within 227 873 E. coli genomes, coloured by % coverage and % identity accordingly. CDS validated by western blot analysis are indicated with a pink star (top). CDS with putative homologs outside of E. coli are indicated with a blue star (second track).
Figure 6.
Figure 6.
Nucleotide identity plots of gene neighbourhoods. Nucleotide sequence identity 2 kb up- and down-stream of each CDS from the E. coli BW25113 reference genome compared with 2 kb surrounding homologs identified within the E. coli database of 227 873 genomes. Each plot shows the % of genomes (y-axis) that have coverage along the reference genome query sequence (x-axis), with the E. coli BW25113 reference sequence indicated below. Regions of 100% identity are shaded. Annotated genes are shown in grey, candidate new genes are highlighted in blue, the mgrR RNA (downstream mgtST) is coloured in green. CDS additionally detected by western blot are indicated with a star.Supplementary Information.

Similar articles

References

    1. Ruiz-Orera J, Albà MM Translation of small open reading frames: roles in regulation and evolutionary innovation. Trends Genet. 2019; 35:186–98. 10.1016/j.tig.2018.12.003. - DOI - PubMed
    1. Makarewich CA, Olson EN Mining for micropeptides. Trends Cell Biol. 2017; 27:685–96. 10.1016/j.tcb.2017.04.006. - DOI - PMC - PubMed
    1. Hellens RP, Brown CM, Chisnall MAW et al. The emerging world of small ORFs. Trends Plant Sci. 2016; 21:317–28. 10.1016/j.tplants.2015.11.005. - DOI - PubMed
    1. Storz G, Wolf YI, Ramamurthi KS Small proteins can No longer Be ignored. Annu Rev Biochem. 2014; 83:753–77. 10.1146/annurev-biochem-070611-102400. - DOI - PMC - PubMed
    1. Islam MS, Shaw RK, Frankel G et al. Translation of a minigene in the 5′ leader sequence of the enterohaemorrhagic Escherichia coli LEE1 transcription unit affects expression of the neighbouring downstream gene. Biochem J. 2012; 441:247–53. 10.1042/BJ20110912. - DOI - PMC - PubMed

MeSH terms

Substances

LinkOut - more resources