. 2025 Aug 11;53(15):gkaf789.
doi: 10.1093/nar/gkaf789.

SLFN11-mediated tRNA regulation induces cell death by disrupting proteostasis in response to DNA-damaging agents

Affiliations

SLFN11-mediated tRNA regulation induces cell death by disrupting proteostasis in response to DNA-damaging agents

Yuki Iimori et al. Nucleic Acids Res. .

Abstract

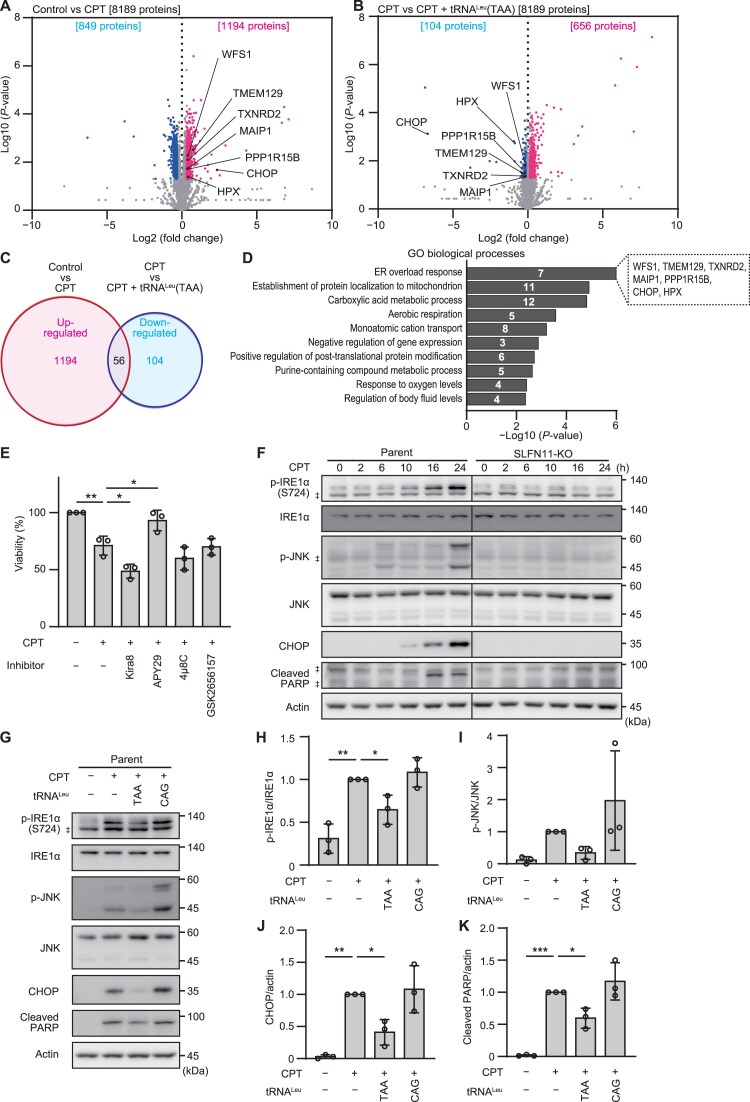
DNA-damaging agents (DDAs) have long been used in cancer therapy. However, the mechanisms by which DDAs induce cell death are not fully understood, and drug resistance remains a major clinical challenge. Schlafen 11 (SLFN11) was identified as the gene most strongly correlated with sensitivity to DDAs based on mRNA expression levels. SLFN11 sensitizes cancer cells to DDAs by cleaving and decreasing tRNALeu(TAA) levels. Elucidating the detailed mechanism by which SLFN11 induces cell death is expected to provide insights into overcoming drug resistance. Here, we show that, upon administration of DDAs, SLFN11 cleaves tRNALeu(TAA), triggering ER stress and protein aggregate formation, leading to cell death regulated by inositol-requiring enzyme 1 alpha (IRE1α). These responses were significantly alleviated by SLFN11-knockout or transfection of tRNALeu(TAA). Proteomic analysis suggests tRNALeu(TAA) influences proteins essential for maintaining proteostasis, especially those involved in ubiquitin-dependent proteolysis. Additionally, we identified the cleavage sites of tRNALeu(TAA) generated by SLFN11 in cells and revealed that tRNA fragments contribute to ER stress and cell death. These findings suggest that SLFN11 plays a crucial role in proteostasis by regulating tRNAs and thus determines cell fate under DDA treatment. Consequently, targeting SLFN11-mediated tRNA regulation could offer a novel approach to improve cancer therapy.


Conflict of interest statement

None declared.

Figures

Graphical Abstract
Graphical Abstract
Figure 1.
Figure 1.
SLFN11-dependent decrease of tRNALeu(TAA) levels induces cell death in human cancer cells during CPT treatment. (A and B) Induction of the apoptotic signature by CPT was quantified at the indicated time points using the annexin V apoptosis assay. TOV-112D parent cells (A) and SLFN11-KO cells (B) were treated with the indicated concentrations of CPT for 24 h. Values are relative to the mean value of the control samples treated with 0.1% DMSO for 24 h. Data are shown as mean ± SD (three technical replicates). The results are representative of two independent experiments. (C) Expression levels of mature or tRF of tRNALeu(TAA) were analyzed by northern blotting. TOV-112D parent cells and SLFN11-KO cells were treated with CPT (100 nM) for the indicated times. Daggers indicate the position of the presumed precursor tRNAs. Long exposure data for the upper panel is shown in the middle panel. SYBR Gold staining of the gel shown in the upper panel is presented in the bottom panel. The marker size is indicated on the right side. Representative data from four independent experiments are shown. (D and E) Quantification of the expression levels of mature tRNA (D) or tRF (E) shown in (C). All data were normalized to the expression levels of 5.8S rRNA in the same sample and are relative to the values of the untreated parent samples at time 0. Data are shown as mean ± SD (four biological replicates). Two-way ANOVA with Dunnett’s multiple comparison tests was used. *P < 0.05, **P < 0.01, and ***P < 0.001. (F) Apoptotic signature of TOV-112D cells assessed after transfection with the indicated full-length tRNA (10 nM) followed by treatment with CPT (100 nM) for 24 h. (G and H) Cell viability of TOV-112D cells assessed after transfection with tRNALeu(TAA) (G) or tRNALeu(CAG) (H) at the indicated doses, followed by treatment with CPT (100 nM) for 36 h. Data are shown as mean ± SD (four biological replicates for panel G, three biological replicates for panel F and H). One-way ANOVA with Dunnett's multiple comparison tests was used. *P < 0.05, **P < 0.01, and ***P < 0.001.
Figure 2.
Figure 2.
Decrease of mature tRNALeu(TAA) levels induces ER stress and causes cell death during CPT treatment. TOV-112D cells were treated with 0.1% DMSO (control), CPT (100 nM), or CPT (100 nM) + full-length tRNALeu(TAA) (10 nM). After 10 h of treatment, the protein expression levels were evaluated by proteomic analysis (three biological replicates). A total of 8189 proteins were detected. (A) Volcano plots of protein expression from TOV-112D cells treated with CPT relative to control cells treated with 0.1% DMSO. A total of 1194 proteins were upregulated (P < 0.05 and fold change [FC] > 1.25) and 849 proteins were downregulated (P < 0.05 and FC < 0.8). (B) Volcano plots of protein expression from TOV-112D cells treated with CPT + full-length tRNALeu(TAA) relative to cells treated with CPT. A total of 656 proteins were upregulated (P < 0.05 and FC > 1.1) and 104 proteins were downregulated (P < 0.05 and FC < 0.9). The proteins involved in ER overload in (D) are annotated in (A) and (B). (C) Venn diagram of the overlap between upregulated proteins in (A) and downregulated proteins in (B). The total number of overlapping proteins is shown in the center. (D) Enrichment analysis of the overlapping proteins is shown in (C). The numbers in the bars indicate the number of proteins in each group. The proteins involved in the ER overload response are annotated on the right of the bar. (E) Cell viability of TOV-112D cells assessed after 24 h of treatment with CPT (100 nM) and the stress sensor inhibitors of the UPR, including Kira8 (1 μM), APY29 (100 nM), 4μ8C (50 μM), and GSK2656157 (1 μM). (F) Western blotting analysis of the time-course of the UPR pathways in TOV-112D parent cells and SLFN11-KO cells after administration of CPT (100 nM). (G) Western blotting analysis of the UPR pathway in TOV-112D parent cells transfected with the indicated tRNA (10 nM) followed by treatment with CPT (100 nM) for 24 h. (HK) Quantification of the expression levels of phospho-IRE1α (H), phospho-JNK (I), CHOP (J), and cleaved PARP (K) shown in (G). All data were normalized to the expression levels of IRE1α (H), JNK (I), or actin (J, K) in the same sample and are relative to the values of samples treated with CPT (100 nM). Representative results from two (F) or three (G) independent experiments are shown. Double daggers indicate the position of the non-specific bands. The marker size is indicated on the right side. In (E and H–K), all data are shown as mean ± SD (three biological replicates). One-way ANOVA with Dunnett’s multiple comparison test was used. *P < 0.05, **P < 0.01, and ***P < 0.001.
Figure 3.
Figure 3.
Decrease of mature tRNALeu(TAA) levels suppresses ubiquitin-dependent proteolysis during CPT treatment. (A and B) Volcano plots of protein expression in TOV-112D cells at 10 h after treatment with CPT (100 nM) relative to control cells treated with 0.1% DMSO (A), or with CPT (100 nM) + full-length tRNALeu(TAA) (10 nM) relative to cells treated with CPT alone (B), shown in Fig. 2A and B. Labels in (A) and (B) indicate the top 10 proteins, downregulated in response to CPT treatment as shown in (A), among those involved in protein modification by small protein conjugation, as categorized in (D). (C) Venn diagram of the overlap between downregulated proteins in (A) and upregulated proteins in (B). The total number of overlapping proteins is shown in the center. (D) Enrichment analysis of the overlapping proteins in (C). The numbers in the bars indicate the number of proteins in each group. The proteins involved in protein modification by small protein conjugation are annotated on the right of the bar. (E and F) Western blotting analysis of the ubiquitinated proteins in TOV-112D parent cells or SLFN11-KO cells treated with CPT (100 nM) for 24 h (E) or parent cells transfected with the indicated tRNA (10 nM) followed by treatment with CPT (100 nM) for 24 h (F). The samples in the four right-hand lanes were treated with MG132 (5 μM) from 18 to 24 h after CPT administration. MG132 is a proteasome inhibitor that prevents protein degradation. Representative results from three independent experiments are shown. Actin was used as a loading control. The marker size is indicated on the right side. (G) Representative immunofluorescence images of protein aggregates stained with PROTEOSTAT in TOV-112D parent or SLFN11-KO cells treated with CPT (100 nM) for 24 h. Representative data from three independent experiments are shown. Scale bar: 50 μm. (H) Quantification of protein aggregates stained with PROTEOSTAT in TOV-112D parent and SLFN11-KO cells transfected with the indicated tRNA (25 nM) followed by treatment with CPT (100 nM) for 24 h. The graphs show the proportion of cells with protein aggregates of the indicated area out of the total cell population. Three independent experiments were performed, and the area of protein aggregates per cell was measured for more than 1000 cells in each group.
Figure 4.
Figure 4.
Potential role of tRNALeu(TAA) in proteostasis regulation through translation. (A) Distribution of UUA codon usage frequency in proteins. A total of 20 679 human coding sequences retrieved from NCBI were analyzed. (B) Enrichment analysis of proteins with a high frequency (>2.5%) of UUA codon (741 proteins) in dataset (A). (CG) Integrated omics analysis of protein and mRNA expression dynamics and their association with UUA codon usage. TOV-112D cells were treated with 0.1% DMSO (control), CPT (100 nM), or CPT (100 nM) + full-length tRNALeu(TAA) (10 nM). After 10 or 24 h of treatment, the protein expression levels were evaluated by proteomic analysis and the mRNA expression levels by RNA-seq analysis (three biological replicates). The genes detected at both the protein and mRNA levels at each time point were classified based on their expression variation patterns, and the UUA codon usage frequency was analyzed for each group. For proteomic analysis, the thresholds described in Fig. 2 were applied. For RNA-seq, genes with fold changes of <0.9 or >1.1 and FDR of <0.05 were defined as differentially expressed. (C) Schematic of gene classification based on protein and mRNA expression changes. Grouping was initially performed based on changes in protein expression, followed by further classification within each group based on mRNA expression. The DU group includes genes downregulated by CPT (versus control) and upregulated by CPT + tRNALeu(TAA) (versus CPT). The UD group includes genes upregulated by CPT (versus control) and downregulated by CPT + tRNALeu(TAA) (versus CPT). Genes that did not fall into either the DU or UD group were classified as Others (O). (D and E) UUA codon usage frequency of the gene groups showing the expression variation pattern in (C) after 10 h (D) or 24 h (E) of CPT treatment. The number in parentheses indicates the number of genes included in each group. The central line represents the median and the dotted line indicates the interquartile range (from the 25th to the 75th percentile). The Kruskal–Wallis test followed by Dunn’s multiple comparisons test were used. *P < 0.05, **P < 0.01, and ***P < 0.001. (F and G) Enrichment analysis of the gene groups classified in (D) and (E), respectively. The numbers in the bars indicate the number of genes in each group.
Figure 5.
Figure 5.
tRFs generated by SLFN11 promote CPT-induced cell death. (A) The secondary structure of mature tRNALeu(TAA) and cleavage site of three representative tRFLeu(TAA) (tRF-1, tRF-2, and tRF-3) are shown. The positions of the nucleotides are indicated by numbers according to the universal tRNA positioning rules [41]. Arrows indicate the cleavage sites. Orange letters indicate cleaved sequences. Pink letters indicate the 5′ leader sequences before processing. (BE) Induction of cell death by tRFs. The apoptotic signature (B and D) and cell viability (C and E) of TOV-112D parent cells (B and C) or SLFN11-KO cells (D and E) were assessed after 24 h of treatment with CPT (100 nM) following transfection with full-length tRNALeu(TAA) or tRFLeu(TAA)-1, -2, or -3 (10 nM). (F and G) Cell viability of TOV-112D parent cells (F) or SLFN11-KO cells (G) assessed after transfection with the indicated tRF-1 (25 nM) followed by treatment with CPT (100 nM) for 48 h. (H) Schematic of the time-course analysis of TOV-112D SLFN11-KO cells treated with tRF-1 (25 nM) and CPT (100 nM). (I) Apoptotic signature quantified in real time up to 24 h using the Annexin V apoptosis assay. Values are relative to the mean value of the control samples treated with CPT (100 nM) for 24 h. Data are shown as the mean ± SD (three technical replicates). The results are representative of two independent experiments. (J) Western blotting analysis of the time-series of the UPR pathway. Representative results from two independent experiments are shown. As a positive control, samples treated with CPT (100 nM) for 36 h in TOV-112D parent cells are placed in the far-right column. Double daggers indicate the position of the non-specific bands. The marker size is indicated on the right side. (K) Apoptotic signature of TOV-112D SLFN11-KO cells assessed 24 h after treatment with APY29 (100 nM) or full-length tRNALeu(TAA) (10 nM) in addition to CPT (100 nM) and tRF-1Leu(TAA) (25 nM). (L) Cell viability of TOV-112D SLFN11-KO cells assessed 48 h after treatment using the same conditions shown in (K). Values are relative to the values of control samples treated with 100 nM CPT. All data in (B–G, K, L) are shown as the mean ± SD (three biological replicates for B–G, K; four biological replicates for L). One-way ANOVA with Dunnett's multiple comparison test was used. *P < 0.05, **P < 0.01, and ***P < 0.001.
Figure 6.
Figure 6.
Model of CPT-induced cell death via SLFN11-dependent tRNA regulation. CPT, a DDA, induces the decrease of tRNALeu(TAA) levels and the production of tRFs in an SLFN11-dependent manner. The decrease of tRNALeu(TAA) levels triggers ER stress, activates the IRE1α−JNK pathway, and upregulates CHOP expression, ultimately leading to IRE1α-regulated cell death. This is accompanied by impaired ubiquitin-dependent proteolysis and accumulation of protein aggregates, contributing to proteostasis disruption. In parallel, tRFs activate the IRE1α−JNK pathway and promote CPT-induced cell death.

Update of

References

    1. Tchounwou PB, Dasari S, Noubissi FK et al. Advances in our understanding of the molecular mechanisms of action of cisplatin in cancer therapy. JEP. 2021; 13:303–28. 10.2147/JEP.S267383. - DOI - PMC - PubMed
    1. Kciuk M, Marciniak B, Kontek R Irinotecan-still an important player in cancer chemotherapy: a comprehensive overview. Int J Mol Sci. 2020; 21:4919. 10.3390/ijms21144919. - DOI - PMC - PubMed
    1. de Sousa Cavalcante L, Monteiro G Gemcitabine: metabolism and molecular mechanisms of action, sensitivity and chemoresistance in pancreatic cancer. Eur J Pharmacol. 2014; 741:8–16. 10.1016/j.ejphar.2014.07.041. - DOI - PubMed
    1. Zoppoli G, Regairaz M, Leo E et al. Putative DNA/RNA helicase Schlafen-11 (SLFN11) sensitizes cancer cells to DNA-damaging agents. Proc Natl Acad Sci USA. 2012; 109:15030–5. 10.1073/pnas.1205943109. - DOI - PMC - PubMed
    1. Barretina J, Caponigro G, Stransky N et al. The Cancer Cell Line Encyclopedia enables predictive modelling of anticancer drug sensitivity. Nature. 2012; 483:603–7. 10.1038/nature11003. - DOI - PMC - PubMed

MeSH terms

LinkOut - more resources