. 2025 Aug 11;53(15):gkaf776.
doi: 10.1093/nar/gkaf776.

Oncodrive3D: fast and accurate detection of structural clusters of somatic mutations under positive selection

Affiliations

Oncodrive3D: fast and accurate detection of structural clusters of somatic mutations under positive selection

Stefano Pellegrini et al. Nucleic Acids Res. .

Abstract

Identifying the genes capable of driving tumorigenesis in different tissues is one of the central goals of cancer genomics. Computational methods that exploit different signals of positive selection in the pattern of mutations observed in genes across tumors have been developed to this end. One such signal of positive selection is clustering of mutations in areas of the three-dimensional (3D) structure of the protein above the expectation under neutrality. Methods that exploit this signal have been hindered by the paucity of proteins with experimentally solved 3D structures covering their entire sequence. Here, we present Oncodrive3D, a computational method that, by exploiting AlphaFold 2 structural models, extends the identification of proteins with significant mutational 3D clusters to the entire human proteome. Oncodrive3D shows sensitivity and specificity on par with state-of-the-art cancer driver gene identification methods exploiting mutational clustering and clearly outperforms them in computational efficiency. We demonstrate, through several examples, how significant mutational 3D clusters identified by Oncodrive3D in different known or potential cancer driver genes can reveal details about the mechanism of tumorigenesis in different cancer types and in clonal hematopoiesis.


Conflict of interest statement

None declared.

Figures

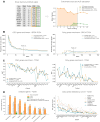
Graphical Abstract
Graphical Abstract
Figure 1.
Figure 1.
Oncodrive3D detects significant mutational 3D clusters in proteins. (A) The left panel describes the input of Oncodrive3D (a list of missense somatic mutations in genes across a cohort of individuals) and the calculation of the profile of trinucleotide changes from this list of mutations. The right panel presents a schematic representation of the calculation of the observed (top) 3D clustering score for spherical volumes containing every mutated residue in a toy protein and of expected (bottom) 3D clustering score for spherical volumes containing residues with synthetic mutations. In 10 000 (or any predetermined number) iterations, synthetic mutations (the same number of observed mutations in every iteration) are generated following the probabilities of trinucleotide changes in the profile, as these represent the underlying process of neutral mutagenesis. (B) The top panel describes the calculation of the significance of the observed 3D clustering score of every mutated residue through a rank-based comparison with the expected 3D clustering scores computed on the basis of synthetic mutations. The bottom panel describes the agglomeration of all residues with significant mutational 3D clustering scores to obtain relevant clumps in the 3D structure of the protein. MAF = Mutation Annotation File, AF = AlphaFold.
Figure 2.
Figure 2.
Performance of Oncodrive3D in comparison with other cluster-based driver discovery methods. (A) Description of the estimation of the sensitivity and specificity of methods aimed at identifying signals of positive selection in the mutational patterns of genes using a toy example. The left panel presents a ranked list of genes (by their P-values) identified by a hypothetical method. Running down the ranking, at every position the fraction of genes of smaller or equal rank to the position in question that are either bona fide cancer genes (annotated in the CGC) or likely false positives (in a manually curated list of “Fishy” genes) is recorded and placed in a plot (right panel). The area under both resulting curves (AUC-CGC and AUC-Fishy) is highlighted in the corresponding color. (B) CGC enrichment (sensitivity estimation) and Fishy enrichment (specificity estimation) curves for Oncodrive3D, OncodriveCLUSTL, and HotMaps on the TCGA-BRCA cohort. The corresponding AUC-CGC and AUC-Fishy are indicated. (C) AUC-CGC and AUC-Fishy values of Oncodrive3D, OncodriveCLUSTL, and HotMaps for 25 TCGA cohorts representing the same number of malignancies. The mean AUC-CGC and AUC-Fishy values for each method are indicated. To calculate AUC values, the genes analyzed by the seven driver discovery methods in the intOGen pipeline were used. (D) The left panel presents the total number of CGC, Fishy, and not-annotated (in either of these two lists) genes identified by seven state-of-the-art driver discovery methods included in the intOGen pipeline and Oncodrive3D. The right panel presents the number of CGC genes identified by the seven methods in every TCGA cohort.
Figure 3.
Figure 3.
Computational efficiency of Oncodrive3D and other driver discovery methods. (A) Efficiency of seven state-of-the-art driver discovery methods and Oncodrive3D in terms of CPU time needed to process 32 TCGA cohorts. The left panel presents the number of CPU-hours used by each method to process each cohort, while the right panel presents the total number of CPU-days consumed by each method in the analysis of all cohorts. (B) Efficiency of seven state-of-the-art driver discovery methods and Oncodrive3D in terms of usage of memory. The left panel presents the maximum GB used by each method to process each separate cohort, while the right panel presents the aggregated GB of memory used by each method in the analysis of all cohorts.
Figure 4.
Figure 4.
Oncodrive3D is complementary to seven other driver detection methods. (A) Number of genes identified by two state-of-the-art driver discovery methods exploiting the clustering of mutations in the linear sequence of proteins (OncodriveCLUSTL) or in their 3D structure (HotMaps) and by Oncodrive3D. The overlap between genes identified by more than one method is represented for all TCGA cohorts through a Venn diagram (top panel) and for every cohort, through differently colored segments of bars. (B) Same as A, restricted to bona fide cancer genes annotated in the CGC. (C) Number of genes identified by seven state-of-the-art driver discovery methods and Oncodrive3D. State-of-the-art methods have been divided into two groups depending on whether they are based on detecting abnormal clustering of mutations in proteins (Clustering) or not (Others). (D) Same as C, restricted to bona fide cancer genes annotated in the CGC. The overlap between genes identified by methods in more than one group is represented through a Venn diagram (all TCGA cohorts; top panels) or through differently colored segments of bars (each cohort; bottom panels).
Figure 5.
Figure 5.
Oncodrive3D significant genes across TCGA cohorts. (A) The central heatmap presents the top 35 significant genes (in terms of number of TCGA cohorts where they are identified) according to Oncodrive3D (cells with an asterisk). The color of the cells represents the 3D clustering score of the residue with the lowest P-value in each gene. The two bar plots above the heatmap represent the total number of missense mutations in each cohort and the total number of genes (annotated in the CGC for the tumor type of the cohort in question, for other tumor types, or not annotated in the CGC) identified as bearing significant mutational 3D clusters by Oncodrive3D. The first rectangular panel by the right side of the heatmap denotes whether the gene is annotated in any of two catalogues of bona fide cancer genes (CGC, OncoKB), or has been identified by the intOGen pipeline [17]. The second rectangular panel denotes which of the driver discovery methods in the intOGen pipeline has identified the gene as a potential cancer driver. The bars at the right represent the number of TCGA cohorts where each gene has been found to bear significant mutational 3D clusters by Oncodrive3D. In the heatmap, only 26 TCGA cohorts (those for which at least one driver gene is identified by Oncodrive3D) are included. (B) Total number of gene–cohort combinations identified as bearing significant mutational 3D clusters by Oncodrive3D.
Figure 6.
Figure 6.
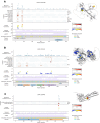
Recurrence of residues with significant mutational 3D clusters across cohorts of tumors. (A) Recurrence of residues with significant mutational 3D clusters in NFE2L2 across 10 cohorts of tumors (annotated at the left of the second track) of seven different organs (annotated at the right of the second panel). (B) Recurrence of residues with significant mutational 3D clusters in EGFR across nine cohorts of tumors of two different organs. (C) Recurrence of residues with significant mutational 3D clusters in GBP4 across two cohorts of tumors of two different organs. In the three graphs, the top track presents the number of mutations affecting each residue of the protein. The second track presents the residues identified as bearing significant mutational 3D clusters by Oncodrive3D in each cohort of tumors analyzed, with the color representing the 3D clustering score of each of them. The third track represents the recurrence of each cluster (fraction of cohorts analyzed where the cluster is significant). The four tracks below present annotations of the protein structure that support the interpretation of the functional relevance of the clusters; from top to bottom: solvent accessibility, AlphaFold local model confidence (proxy for backbone rigidity), secondary structure, and functional domains.

Similar articles

References

    1. Dees ND, Zhang Q, Kandoth C et al. MuSiC: identifying mutational significance in cancer genomes. Genome Res. 2012; 22:1589–98. 10.1101/gr.134635.111. - DOI - PMC - PubMed
    1. Lawrence MS, Stojanov P, Polak P et al. Mutational heterogeneity in cancer and the search for new cancer-associated genes. Nature. 2013; 499:214–8. 10.1038/nature12213. - DOI - PMC - PubMed
    1. Martincorena I, Raine KM, Gerstung M et al. Universal patterns of selection in cancer and somatic tissues. Cell. 2017; 171:1029–41. 10.1016/j.cell.2017.09.042. - DOI - PMC - PubMed
    1. Gonzalez-Perez A, Lopez-Bigas N Functional impact bias reveals cancer drivers. Nucleic Acids Res. 2012; 40:e169. 10.1093/nar/gks743. - DOI - PMC - PubMed
    1. Tamborero D, Gonzalez-Perez A, Lopez-Bigas N OncodriveCLUST: exploiting the positional clustering of somatic mutations to identify cancer genes. Bioinformatics. 2013; 29:2238–44. 10.1093/bioinformatics/btt395. - DOI - PubMed