. 2025 Nov;67(11):2999-3013.
doi: 10.1111/jipb.70015. Epub 2025 Aug 14.

The miR172a-ERF416/413 module regulates soybean seed traits

Affiliations

The miR172a-ERF416/413 module regulates soybean seed traits

Meng Jin et al. J Integr Plant Biol. 2025 Nov.

Abstract

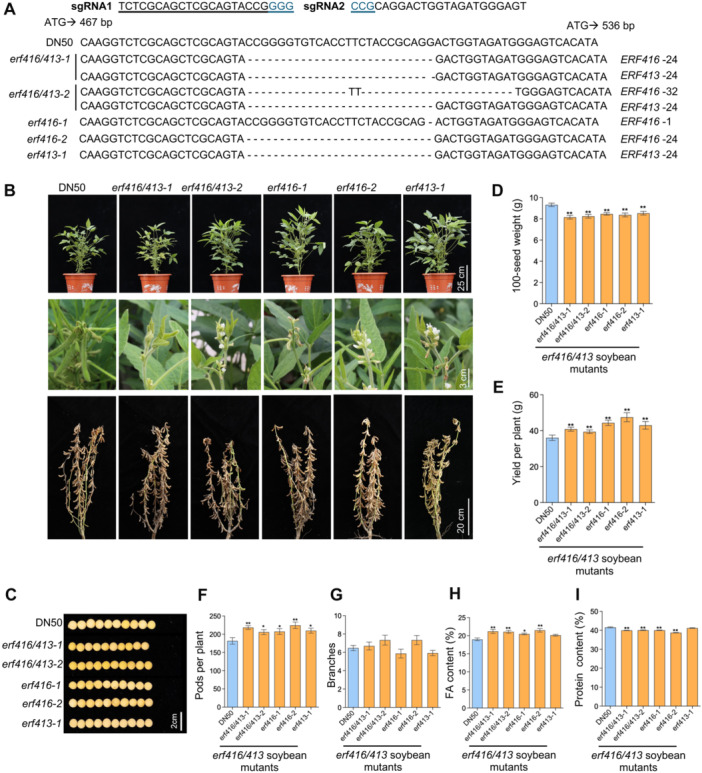
Soybean (Glycine max) provides vegetable oils and proteins for human consumption. Its production depends on seeds and other production-related agronomic traits. How the seed traits are regulated in soybean remains largely unclear. In this study, we identified a miR172a-ERF416/413 module for the regulation of seed traits. The miR172a can cleave the targets ERF416 and ERF413 to affect the downstream gene expression for the reduction of soybean seed size and weight. Both the MIR172a-overexpressing transgenic soybean plants and the erf416/413 mutants produced smaller seeds than the control. Consistently, the ERF416-overexpressing transgenic soybean plants generated larger seeds. ERF416 and ERF413 were directly targeted to the promoter of GmKIX8-1 and GmSWEET10a to regulate their gene expression for seed size/weight control. Interestingly, the erf416/413 mutants showed higher seed yield per plant and higher total seed fatty acid (FA) content, whereas the MIR172a-transgenic soybean had lower total seed FA content compared with the control cultivar, suggesting that miR172a and ERF416/413 may function in FA accumulation through different pathways. Haplotypes of the ERF416 promoter region were further analyzed and Hap1 was correlated with higher gene expression and higher seed weight, while Hap3 was correlated with higher total seed lipid content. Our study revealed a new module for seed trait control. Manipulation of such alleles should facilitate breeding for high-oil and high-yield soybean cultivars.

Keywords: ERF416/ERF413 transcription factors; fatty acids; miR172a; seed size/weight; soybean.


Conflict of interest statement

The authors declare no conflicts of interest.

Figures

Figure 1
Figure 1
Seeds and other agronomic traits of MIR172a transgenic soybean plants (A) miR172a transgene expression in MIR172a transgenic plants. The quantitative polymerase chain reaction (qPCR) was used for the analysis and U6 was used as a control. Each data point indicates the mean ± SD (n = 3 biological replicates). (B) Phenotype comparison of JACK and MIR172a transgenic plants at the reproductive stage and the maturation stage. Top row: The phenotype of plants grown in pots. Middle row: The phenotype of plants at the pod‐setting stage. Bottom row: The phenotype of plants at the maturation stage. (C) Comparison of seeds from JACK and MIR172a transgenic soybean plants. Ten seeds were used for photography. Scale bar = 1 cm. (D) Hundred‐seed‐weight of JACK and MIR172a transgenic plants. (E) The yield per plant of JACK and MIR172a transgenic plants. (F) The pods per plant of JACK and MIR172a transgenic plants. (G) The branches per plant of JACK and MIR172a transgenic plants. (H) Comparison of the seed fatty acid content in JACK and MIR172a transgenic plants. (I) Seed protein content in JACK and MIR172a transgenic plants. For (D) to (I), asterisks indicate significant differences compared with the corresponding JACK control (*P < 0.05; **P < 0.01; Student's t‐test). Each data point indicates the mean ± SD from five individual plants.
Figure 2
Figure 2
Identification and molecular characterization of the miR172a target genes ERF416 and ERF413 (A) The expression of ERF416 and ERF413 in the middle‐seed stage of MIR172a transgenic plants. Each data point indicates mean ± SD (n = 4 biological replicates). (B) Cleavage of the target genes ERF416 and ERF413 by miR172a. Blue arrows above the mRNA of targets indicate detected cleavage sites. The numbers beside the blue arrows indicate the ratio of cleavage (cleaved target vs. total sequenced clones) through 5′RACE analysis. (C) Schematic representation of ERF416 and ERF413 domain structure. Numbers above the AP2 domain indicate the amino acid positions. (D) Organ‐specific expression of ERF416 and ERF413. Each data point indicates the mean ± SD (n = 3 biological replicates). (E) Subcellular localization of ERF416 and ERF413 in N. benthamiana epidermal cells. Scale bar = 20 μm. (F) Schematic representation of effector and reporter constructs used for analysis of transcriptional regulatory activity. (G) Analysis of transcriptional regulatory activity of ERF416 and ERF413 in Arabidopsis protoplast assay. VP16 was used as a positive control. Each data point indicates the mean ± SD (n = 4 biological replicates). (H) Interaction of ERF416 and ERF413 in a yeast‐two‐hybrid assay. Yeast cells harboring different combinations of plasmids were grown on selective media for 3 d. −AHLW‐X indicates Ade, His, Leu, Trp, and X‐α‐gal drop‐out plates. −LW indicates Leu and Trp drop‐out plates. For (A) and (G), the asterisks indicate significant differences compared with the corresponding control (**P < 0.01; Student's t‐test).
Figure 3
Figure 3
Generation of the ERF416 and ERF413 soybean mutants and evaluation of their yield‐related traits (A) The editing site sequences of ERF416 and ERF413 in various soybean mutants obtained by using CRISPR/Cas9 technology. erf416/413‐1, and erf416/413‐2 represent double mutants. erf416‐1, erf416‐2, and erf413‐1 represent single mutants. The DN50 sequence is also shown as a reference, and this region is the same in the ERF416 and ERF413 genes. (B) Phenotype of the ERF416 and ERF413 single and double mutants at the reproductive stage and the maturation stage. Top row: The phenotype of plants grown in pots. Middle row: The phenotype of plants at pod‐setting stage. Bottom row: The phenotype of plants at the maturation stage. (C) Comparison of seeds from DN50 and the ERF416 and ERF413 mutants. Ten seeds were used for photography. Scale bar = 2 cm. (D) Hundred‐seed weight from DN50 and ERF416 and ERF413 soybean mutants. (E) The yield per plant from DN50 and ERF416 and ERF413 soybean mutants. (F) The pods per plant from DN50 and ERF416 and ERF413 soybean mutants. (G) The branches per plant of DN50 and ERF416 and ERF413 soybean mutants. (H) Comparison of the seed fatty acid (FA) content in DN50 and ERF416 and ERF413 soybean mutants. Each data point indicates the mean ± SD (n = 4 biological replicates). (I) The seed protein content in DN50 and ERF416 and ERF413 soybean mutants. Each data point indicates the mean ± SD (n = 4 biological replicates). For (D) to (I), the asterisks indicate significant differences compared with the corresponding control (*P < 0.05; **P < 0.01; Student's t‐test). For (D) to (G), each data point indicates mean ± SD from 15 individual plants.
Figure 4
Figure 4
Effects of ERF416 overexpression on seeds and other yield‐related traits in transgenic soybean (A) Schematic diagram of the miR172a cleavage site in ERF416, which underwent amino acid synonymous substitution. The substituted rERF416 cannot be cleaved by miR172a and is used for soybean transformation. (B) Relative expression of ERF416 in seeds from the middle stage from ERF416‐ovexpressing transgenic soybean. Each data point indicates the mean ± SD (n = 3 biological replicates). (C) Phenotype comparison of DN50 and ERF416 transgenic soybean at reproductive stage and maturation stage. Top row: The phenotype of plants grown in pots. Bottom row: The phenotype of plants at maturation stage. (D) Comparison of seed size from DN50 and ERF416 transgenic soybean. Ten seeds were used for photography. Scale bar = 2 cm. (E) 100‐seed‐weight of DN50 and ERF416 transgenic soybean. (F) The yield per plant of DN50 and ERF416 transgenic soybean. (G) The pods per plant of DN50 and ERF416 transgenic soybean. (H) The branches per plant of DN50 and ERF416 transgenic soybean. (I) Comparison of the seed total FA content in DN50 and ERF416 transgenic soybean. Each data point indicates mean ± SD (n = 4 biological replicates). (J) Seed protein content in DN50 and ERF416 transgenic soybean. Each data point indicates mean ± SD (n = 4 biological replicates). For (E) to (J), the asterisks indicate significant differences compared with the corresponding control (*P < 0.05; **P < 0.01; Student's t‐test). For (E) to (H), each data point indicates mean ± SD from fifteen individual plants.
Figure 5
Figure 5
RNA‐seq analysis identifies downstream genes regulated by ERF416 and ERF413 (A) Venn diagram of differentially expressed genes regulated by ERF416 and ERF413. Middle‐staged seeds from DN50, erf416/413‐1 double mutants and erf416‐1 and erf413‐1 single mutants were used for the RNA‐seq analysis, and genes with a fold change of ≥1.5 (P‐value < 0.05) were selected for analysis. (B) Gene Ontology enrichment analysis of differentially expressed genes regulated by ERF416 and ERF413. (C) Volcano plots of the differentially expressed genes regulated by ERF416 and ERF413. (D) The expression level of GmKIX8‐1 in the early‐stage seeds of erf416/413 mutants and ERF416‐overexpressing transgenic soybean. Each data point indicates mean ± SD (n = 3 biological replicates). (E) Left panel: Schematic diagrams of the effector and reporter constructs and effects of ERF416 and ERF413 on KIX8‐1 promoter activity. The reporter construct contains the firefly luciferase (LUC) reporter gene, driven by the KIX8‐1 promoter. Middle panel: The effectors and the reporter constructs were transfected into Nicotiana benthamiana leaves by infiltration for transient assay. Right panel: The relative LUC activity is indicated by the LUC/REN ratio. Each data point indicates mean ± SD (n = 6 biological replicates). (F) Schematic representation of GmKIX8‐1 promoter showing primers and probes used for chromatin immunoprecipitation‐quantitative polymerase chain reaction (ChIP‐qPCR) and electrophoretic mobility shift assay (EMSA). Blue boxes represent the GCC box, yellow lines represent the primers used for ChIP‐qPCR, and green triangles represent the probes. Please note that only P2 contains the GCC box for ERF protein binding. Other probes were used as controls. (G) Electrophoretic mobility shift assay showing that the ERF416 and ERF413 protein binds to the promoter fragments P2 of the GmKIX8‐1 promoter. Binding reactions were carried out with the recombinant ERF416 and ERF413 proteins and biotin‐labeled probes in the absence or presence of a 100‐fold excess of unlabeled probes as competitors. The arrow indicates the band of protein/DNA complex. (H) Chromatin immunoprecipitation‐qPCR analysis of GmKIX8‐1 in ERF416 and ERF413 transgenic hairy roots. Each data point indicates the mean ± SD (n = 3 biological replicates). For (D, E, and H), the asterisks indicate significant differences compared with the corresponding control (**P < 0.01; Student's t‐test).
Figure 6
Figure 6
The ERF416 and ERF413 directly bind to and activate the SWEET10a promoter activity (A) SWEET10a relative expression in early‐stage seeds from erf416/413 mutants and the ERF416‐overexpressing transgenic soybean. Each data point indicates the mean ± SD (n = 3 biological replicates). (B) Left panel: Schematic diagrams of the effector and reporter constructs and effects of ERF416 and ERF413 on SWEET10a promoter activity. The reporter construct contains the firefly luciferase (LUC) reporter gene, driven by the SWEET10a promoter. Middle panel: The effectors and the reporter constructs were transfected into Nicotiana benthamiana leaves by infiltration for transient assay. Right panel: The relative LUC activity is indicated by the LUC/REN ratio. Each data point indicates the mean ± SD (n = 6 biological replicates). (C) Schematic representation of GmSWEET10a promoter showing primers and probes used for chromatin immunoprecipitation‐quantitative polymerase chain reaction (ChIP‐qPCR) and electrophoretic mobility shift assay (EMSA). Blue boxes represent CAACAA, yellow lines represent primers used for ChIP‐qPCR, and orange triangles represent probes. (D) Binding ability of ERF416 and ERF413 to the SWEET10a promoter region. Three probes containing the CAACAA box in the SWEET10a promoter were used for the analysis. Arrows indicate the protein/DNA complex. (E) Chromatin immunoprecipitation‐qPCR analysis of the SWEET10a in ERF416 transgenic plants. Each data point indicates the mean ± SD (n = 6 biological replicates). For (A), (B) and (E), the asterisks indicate significant differences compared with the corresponding control (*P < 0.05; **P < 0.01; Student's t‐test).
Figure 7
Figure 7
Correlation of the ERF416 promoter haplotypes with seed traits and a working model for the miR172a‐ERF416/ERF413 module in seed trait regulation in soybean (A) Haplotype variation of the ~3 kb ERF416 promoter region in cultivated soybeans and wild soybeans. (B) Correlation of ERF416 haplotypes with gene expression. The “n” indicates the number of accessions belonging to each haplotype. (C) Correlation of the ERF416 haplotypes with 100‐seed weight from wild and cultivated soybean accessions. The “n” indicates the number of accessions belonging to each haplotype. (D) Correlation of the ERF416 haplotypes with total lipids in seeds of wild and cultivated soybean accessions. The “n” indicates the number of accessions belonging to each haplotype. (E) Distribution of the haplotypes in soybean accessions from different ecological growing regions. “Northeastern” indicates accessions from northeastern growing region. “HHH” indicates accessions from the Huang‐Huai‐Hai growing region. ‘Southern’ indicates accessions from the southern growing region. (F) A working model of miR172a‐ERF416/413 module in the regulation of soybean seed traits. miR172a most likely cleaves the ERF416 and ERF413 to promote KIX8‐1 expression but inhibit SWEET10a expression for the reduction of seed size/weight. miR172a and ERF416 may also suppress the total FA content in soybean seeds through different pathways. The arrows indicate positive regulation and the “T” symbols indicate negative regulation. The solid lines are based on clear evidence. The dashed lines indicate unknown pathways.

References

    1. Chen, X. , Liu, C. , Guo, P. , Hao, X. , Pan, Y. , Zhang, K. , Liu, W. , Zhao, L. , Luo, W. , He, J. , et al. (2023). Differential SW16.1 allelic effects and genetic backgrounds contributed to increased seed weight after soybean domestication. J. Integr. Plant Biol. 65: 1734–1752. - PubMed
    1. Du, J. , Wang, S. , He, C. , Zhou, B. , Ruan, Y.L. , and Shou, H. (2017). Identification of regulatory networks and hub genes controlling soybean seed set and size using RNA sequencing analysis. J. Exp. Bot. 68: 1955–1972. - PMC - PubMed
    1. Duan, Z. , Zhang, M. , Zhang, Z. , Liang, S. , Fan, L. , Yang, X. , Yuan, Y. , Pan, Y. , Zhou, G. , Liu, S. , et al. (2022). Natural allelic variation of GmST05 controlling seed size and quality in soybean. Plant Biotechnol. J. 20: 1807–1818. - PMC - PubMed
    1. Ge, L. , Yu, J. , Wang, H. , Luth, D. , Bai, G. , Wang, K. , and Chen, R. (2016). Increasing seed size and quality by manipulating BIG SEEDS1 in legume species. Proc. Natl. Acad. Sci. U.S.A. 113: 12414–12419. - PMC - PubMed
    1. Gu, Y. , Li, W. , Jiang, H. , Wang, Y. , Gao, H. , Liu, M. , Chen, Q. , Lai, Y. , and He, C. (2017). Differential expression of a WRKY gene between wild and cultivated soybeans correlates to seed size. J. Exp. Bot. 68: 2717–2729. - PMC - PubMed

MeSH terms

LinkOut - more resources