. 2025 Aug 9:20:9807-9823.
doi: 10.2147/IJN.S532080. eCollection 2025.

Enhanced NIR-II Nanoparticle Probe for PSMA-Targeted Molecular Imaging and Prostate Cancer Diagnosis

Affiliations

Enhanced NIR-II Nanoparticle Probe for PSMA-Targeted Molecular Imaging and Prostate Cancer Diagnosis

Zhongji Jiang et al. Int J Nanomedicine. .

Abstract

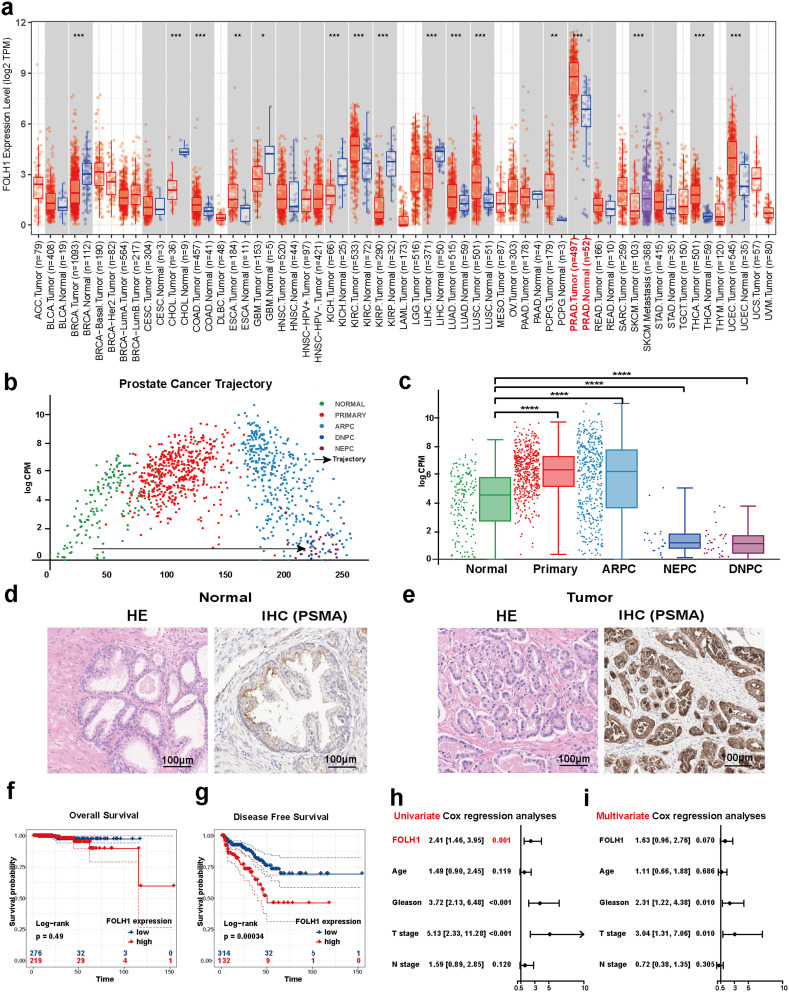
Introduction: Prostate-specific membrane antigen (PSMA) is a well-established biomarker overexpressed in prostate cancer (PCa). However, existing PSMA-targeted imaging probes suffer from radiation exposure, limited tissue penetration, and inadequate intraoperative performance. To overcome these challenges, we developed a novel near-infrared-II (NIR-II) fluorescent nanoprobe for both in vivo and ex vivo imaging of PCa.

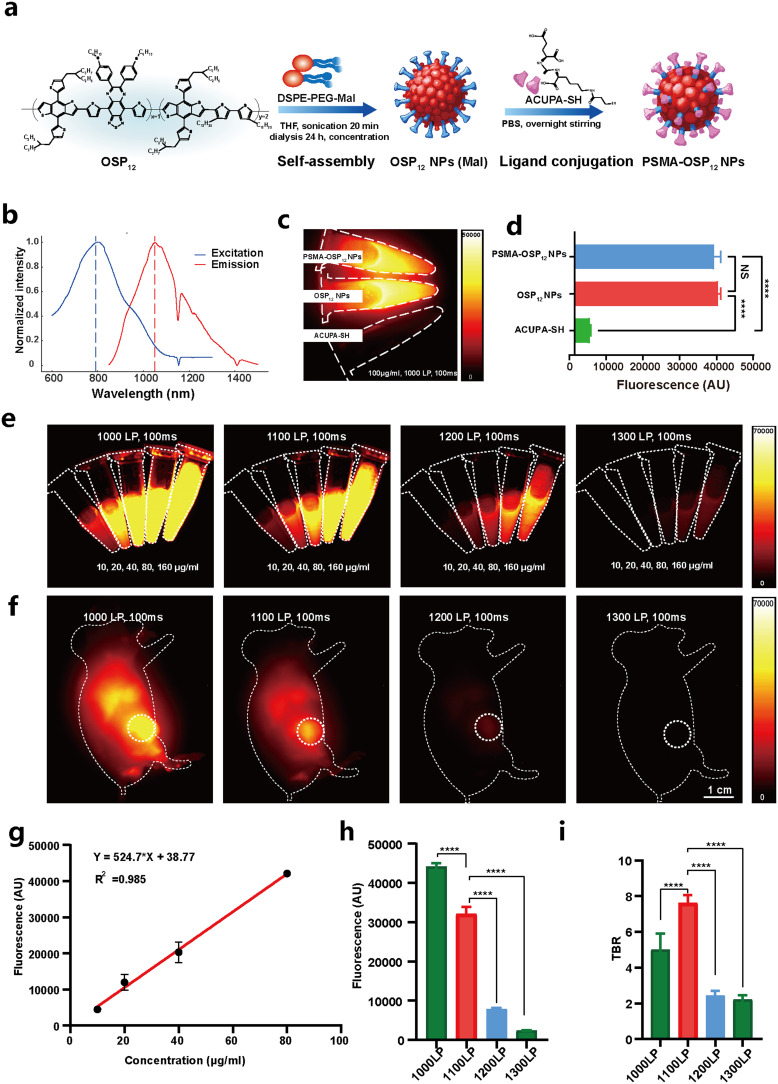
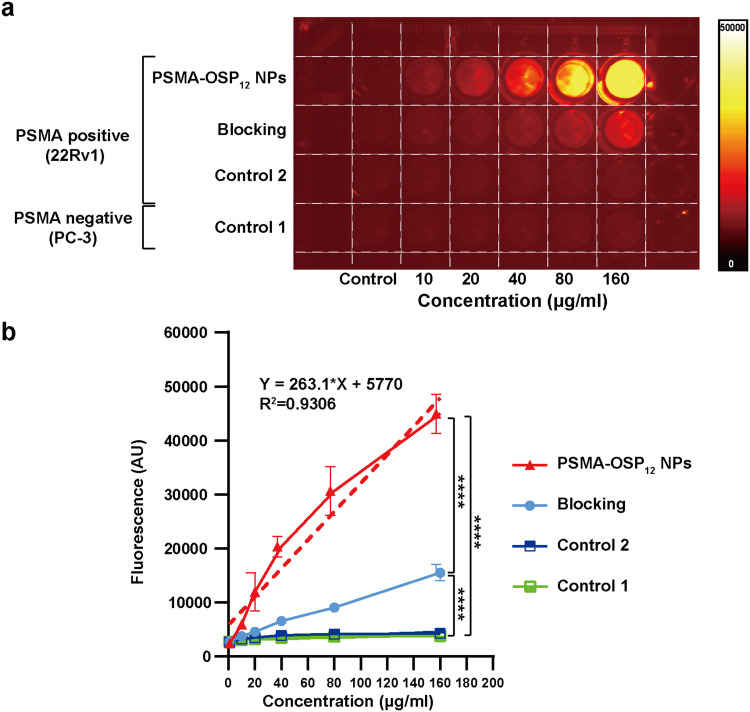
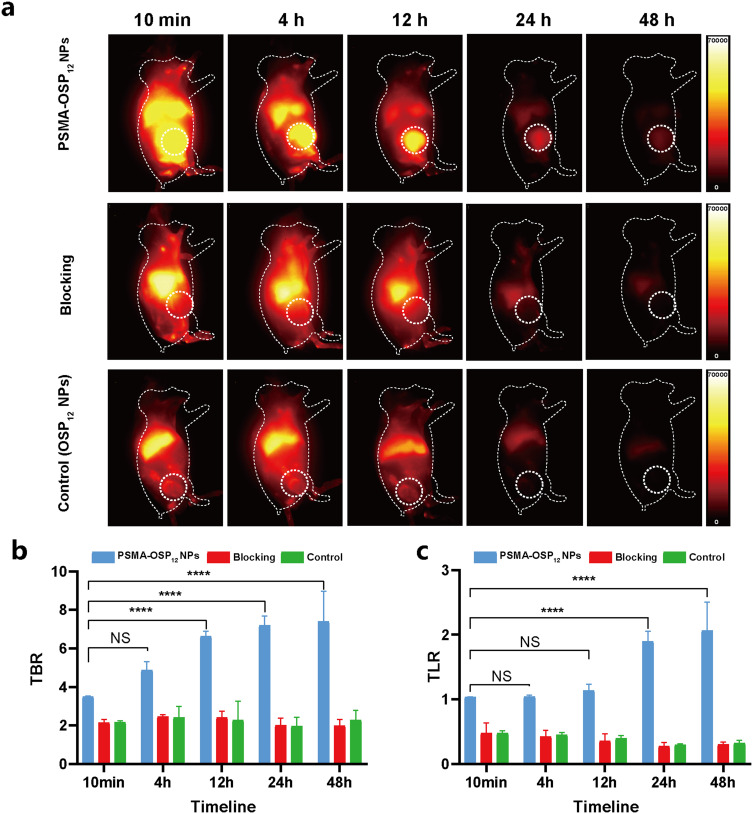
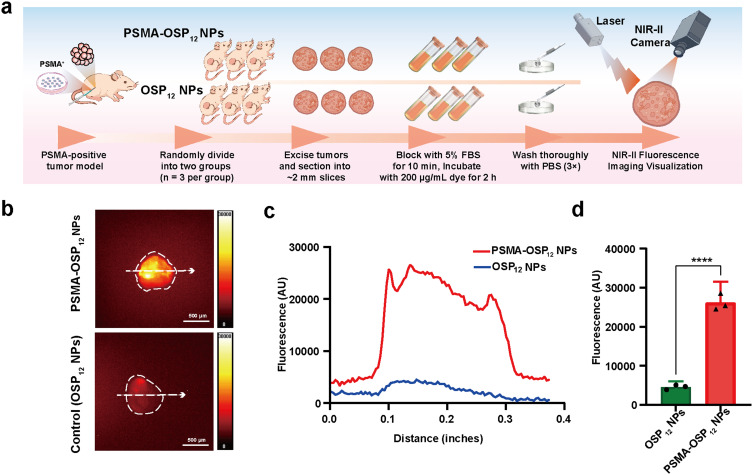
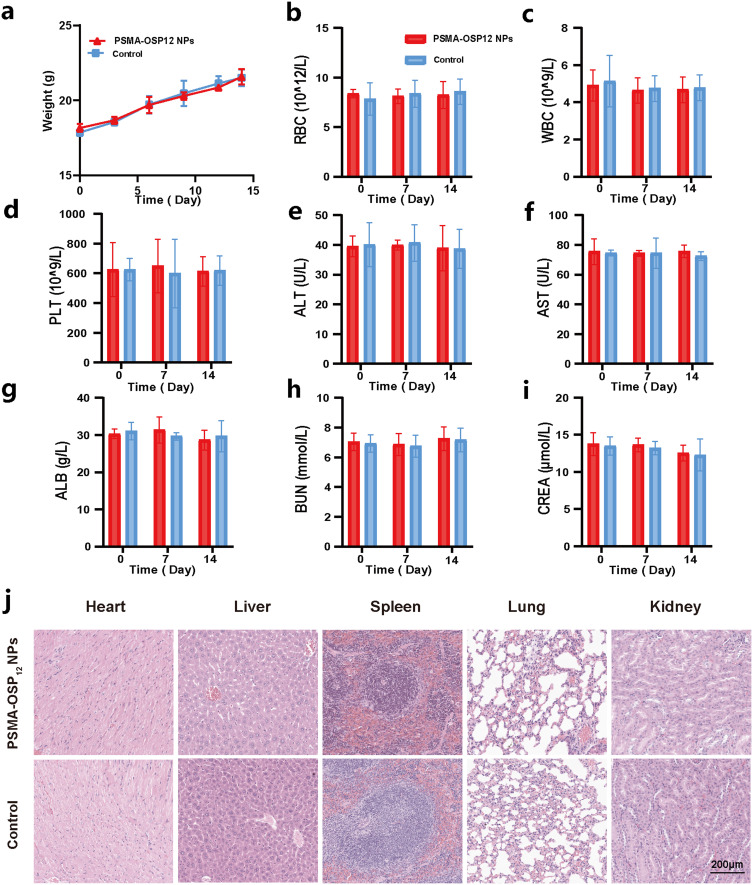
Methods: An organic semiconducting polymer (OSP12) with strong NIR-II fluorescence and excellent photostability was self-assembled into nanoparticles (NPs) using DSPE-PEG-Mal. These OSP12 NPs were then conjugated with ACUPA-SH, (S)-2-[3-((S)-5-amino-1-carboxypentyl)ureido]pentanedioic acid, a thiol-modified glutamate-urea-lysine derivative that specifically targets PSMA, via a maleimide-thiol click reaction to form PSMA-OSP12 NPs. The probe's targeting specificity was assessed using PSMA positive and negative cell lines under NIR-II imaging. For in vivo evaluation, subcutaneous xenograft tumors were established in BALB/c nude mice. Animals were randomly assigned to PSMA-OSP12 NP, blocking (ACUPA pre-injection), and control (OSP12 NPs) groups (n = 3 per group). Ex vivo tumor slice imaging was performed on fresh tissue sections. Biosafety was evaluated in healthy mice (n=5) through hematological, biochemical, and histopathological analyses.

Results: PSMA-OSP12 NPs exhibited excellent optical properties in the NIR-II window, including high photostability, negligible autofluorescence, and deep tissue penetration. In vitro assays confirmed selective binding to PSMA-positive cells, while in vivo imaging demonstrated sustained tumor accumulation with a peak TBR of 7.40 ± 1.28 at 48 h post-injection. This performance significantly surpassed OTL78 and Cy-KUE-OA, enabling flexible surgical planning and real-time intraoperative guidance. In ex vivo tissue imaging, PSMA-OSP12 NPs provided high-contrast tumor delineation without systemic administration. Biosafety evaluations revealed no significant systemic toxicity, and biodistribution analysis indicated hepatic metabolism and biliary clearance.

Conclusion: PSMA-OSP12 NPs are a promising NIR-II fluorescent probe with excellent tumor specificity, deep tissue imaging capability, and good biocompatibility, supporting their application in fluorescence-guided surgery and ex vivo tumor evaluation.

Keywords: NIR-II; fluorescence-guided surgery; molecular imaging; nanoparticles; organic semiconducting polymer; prostate cancer; prostate-specific membrane antigen; tumor targeting.


Conflict of interest statement

The authors declare no conflicts of interest.

Figures

Figure 1
Figure 1
Expression profile and prognostic significance of PSMA (FOLH1) in prostate cancer. (a) PSMA expression across 33 cancer types, as analyzed from the TIMER database (Student’s t-test). (b) Pseudotime trajectory of prostate cancer progression constructed from transcriptomic profiles in the Prostate Cancer Atlas. (c) PSMA expression levels in normal prostate tissue (n = 167), primary prostate cancer (n = 499), androgen receptor-positive prostate cancer (ARPC, n = 418), neuroendocrine prostate cancer (NEPC, n = 34), and double-negative prostate cancer (DNPC, n = 22), with comparisons to the normal group (one-way ANOVA with Dunnett’s post hoc test). (d and e) Representative HE and PSMA IHC staining of matched normal and tumor tissues (n = 3). (f and g) Kaplan–Meier survival analysis showing overall survival (OS) and disease-free survival (DFS) in patients stratified by PSMA expression levels (Log rank test). (h and i) Univariate and multivariate Cox regression analyses identifying PSMA expression as an independent prognostic factor in prostate cancer (Cox proportional hazards model). *P < 0.05, **P < 0.01, ***P < 0.001, ****P < 0.0001. Scale bar: 100 µm.
Figure 2
Figure 2
Synthesis, optical characterization, and imaging performance of PSMA-OSP12 NPs. (a) Schematic illustration of PSMA-OSP12 NPs synthesis. OSP12 self-assembles with DSPE-PEG-Mal to form micelles with maleimide terminals, which are conjugated to ACUPA-SH via thiol–maleimide chemistry. (b) Excitation (blue) and emission (red) spectra of PSMA-OSP12, showing NIR-II fluorescence characteristics. (c) Comparative fluorescence imaging of ACUPA-SH, OSP12 NPs, and PSMA-OSP12 NPs under identical conditions (100 μg/mL; 1000 nm LP filter). (d) Quantification of fluorescence intensities from (c) (one-way ANOVA). (e) In vitro fluorescence imaging of PSMA-OSP12 NPs at serial concentrations (10–160 μg/mL) under different long-pass (LP) filters (1000–1300 nm). (f) In vivo fluorescence imaging of tumor-bearing mice injected with PSMA-OSP12 NPs under the same LP filters and exposure conditions. (g) Linear relationship between fluorescence intensity and probe concentration (R² = 0.997). (h) Quantified fluorescence intensity of tumors under different LP filters (one-way ANOVA vs 1100 nm LP). (i) Tumor-to-background ratio (TBR) under varying LP filters showing maximum imaging contrast at 1100 nm (one-way ANOVA). All imaging was performed using a laser power of 60 mW/cm² and an exposure time of 100 ms. ****P < 0.0001, 1 cm.
Figure 3
Figure 3
In vitro binding specificity and blocking validation of PSMA-OSP12 NPs. (a) Fluorescence imaging of PSMA-positive 22Rv1 and PSMA-negative PC-3 cells under four treatment conditions: control 1, PSMA-negative PC-3 cells incubated with PSMA-OSP12 NPs; control 2, 22Rv1 cells incubated with free OSP12 NPs (non-targeted); blocking group, 22Rv1 cells pretreated with ACUPA-SH (10 μM, 1 h) prior to PSMA-OSP12 NPs exposure; and experimental group, 22Rv1 cells directly incubated with PSMA-OSP12 NPs (10–160 μg/mL, 24 h). (b) Quantification of fluorescence intensities revealed a significant, concentration-dependent increase in the experimental group. In contrast, control 1 (PC-3 + PSMA-OSP12 NPs) and control 2 (22Rv1 + free OSP12 NPs) showed no significant difference and maintained low signal levels. Blocking with ACUPA-SH markedly reduced fluorescence intensity, confirming the PSMA-specific binding of PSMA-OSP12 NPs (two-way ANOVA). (n = 3 per group). ****P < 0.0001.
Figure 4
Figure 4
In vivo tumor targeting and biodistribution of PSMA-OSP12 NPs. (a) Representative NIR-II fluorescence images of 22Rv1 xenograft-bearing mice at multiple time points following intravenous injection of non-targeted OSP12 NPs (control group), PSMA-OSP12 NPs with ACUPA pre-blocking (blocking group), or PSMA-OSP12 NPs (experimental group). Imaging was performed under identical parameters (808 nm excitation, 1100 nm long-pass filter, 100 ms exposure). (b and c) Quantitative analysis of tumor-to-background ratio (TBR) and tumor-to-liver ratio (TLR) demonstrates significantly higher tumor accumulation and specificity in the PSMA-OSP12 NPs group relative to both control and blocking groups (two-way ANOVA) and Post hoc power analysis. ****P < 0.0001.
Figure 5
Figure 5
Ex vivo tumor-specific visualization using PSMA-OSP12 NPs. (a) Schematic diagram of the ex vivo NIR-II imaging workflow. Tumor-bearing mice (22Rv1 xenografts, n = 6) were randomly divided into two groups (n = 3 per group). Excised tumors were sectioned into ~2 mm slices, blocked with 5% FBS for 10 min, then incubated with either OSP12 NPs (control group) or PSMA-OSP12 NPs (experimental group) at 200 μg/mL for 2 h at room temperature, followed by three PBS washes. Imaging was performed using an NIR-II system (808 nm laser, 1100 nm long-pass filter, 100 ms exposure). (b and c) Representative fluorescence images and corresponding intensity profiles of tumor slices showed markedly stronger signal in the PSMA-OSP12 NPs group. (d) Quantification of fluorescence intensity confirmed significantly enhanced tumor labeling in the PSMA-OSP12 NPs group compared to control (Student’s t-test, ****P < 0.0001). Scale bar, 500 μm.
Figure 6
Figure 6
Biosafety evaluation of PSMA-OSP12 NPs. (a) Body weight monitoring of mice treated with PSMA-OSP12 NPs or PBS over a 14-day period showed no significant differences. (bd) Hematological parameters, including red blood cell (RBC) count, white blood cell (WBC) count, and platelet (PLT) count, remained within normal ranges in both groups. (ei) Serum biochemical markers related to liver and kidney function, including alanine aminotransferase (ALT), aspartate aminotransferase (AST), albumin (ALB), blood urea nitrogen (BUN), and creatinine (CREA), showed no significant abnormalities in the PSMA-OSP12 NP group compared to controls. (j) Representative hematoxylin and eosin (HE) staining of major organs (heart, liver, spleen, lung, kidney) revealed no visible pathological lesions in either group. No statistically significant differences were observed across all parameters (n=5 per group, two-way ANOVA). Scale bar, 200 μm.

Similar articles

References

    1. James ND, Tannock I, N’Dow J, et al. The Lancet Commission on prostate cancer: planning for the surge in cases. Lancet. 2024;403(10437):1683–1722. doi: 10.1016/S0140-6736(24)00651-2 - DOI - PMC - PubMed
    1. Jiang Z, Kadeerhan G, Zhang J, Guo W, Guo H, Wang D. Advances in prostate-specific membrane antigen-targeted theranostics: from radionuclides to near-infrared fluorescence technology. Front Immunol. 2025;15. - PMC - PubMed
    1. Sailer V, von Amsberg G, Duensing S, et al. Experimental in vitro, ex vivo and in vivo models in prostate cancer research. Nat Rev Urol. 2023;20(3):158–178. doi: 10.1038/s41585-022-00677-z - DOI - PubMed
    1. Bray F, Laversanne M, Sung H, et al. Global cancer statistics 2022: GLOBOCAN estimates of incidence and mortality worldwide for 36 cancers in 185 countries. CA. 2024;74(3):229–263. doi: 10.3322/caac.21834 - DOI - PubMed
    1. Siegel RL, Giaquinto AN, Jemal A. Cancer statistics, 2024. CA. 2024;74(1):12–49. doi: 10.3322/caac.21820 - DOI - PubMed

LinkOut - more resources