. 2025 Jul 30:19:1533034.
doi: 10.3389/fnhum.2025.1533034. eCollection 2025.

Linear and nonlinear multidimensional functional connectivity methods reveal similar networks for semantic processing in EEG/MEG data

Affiliations

Linear and nonlinear multidimensional functional connectivity methods reveal similar networks for semantic processing in EEG/MEG data

Setareh Rahimi et al. Front Hum Neurosci. .

Abstract

Introduction: Investigating task- and stimulus-dependent connectivity is key to understanding how the interactions between brain regions underpin complex cognitive processes. Yet, the connections identified depend on the assumptions of the connectivity method. To date, methods designed for time-resolved electroencephalography/magnetoencephalography (EEG/MEG) data typically reduce signals in regions to one time course per region. This may fail to identify critical relationships between activation patterns across regions. Time-Lagged Multidimensional Pattern Connectivity (TL-MDPC) is a promising new EEG/MEG functional connectivity method improving previous approaches by assessing multidimensional relationships between patterns of brain activity. However, TL-MDPC remains linear and may therefore miss nonlinear interactions among brain areas.

Methods: Thus, we introduce Nonlinear TL-MDPC (nTL-MDPC), a novel bivariate functional connectivity method for event-related EEG/MEG applications, and compare its performance to the original linear TL-MDPC. nTL-MDPC describes how well patterns in ROI X at a time point t x can predict patterns of ROI Y at a time point t y using artificial neural networks.

Results: Applying this method and its linear counterpart to simulated data demonstrates that both can identify nonlinear dependencies, with nTL-MDPC achieving up to ~0.75 explained variance under optimal conditions (e.g., high SNR), compared to ~0.65 with TL-MDPC. However, with a sufficient number of trials- e.g., a trials-to-vertex ratio ≥10:1 - nTL-MDPC achieves up to 15% higher explained variance than the linear method. Nevertheless, application to a real EEG/MEG dataset demonstrated only subtle increases in nonlinear connectivity strength at longer time lags with no significant differences between the two approaches.

Discussion: Overall, this suggests that linear multidimensional methods may be a reasonable practical choice to approximate brain connectivity, given the additional computational demands of nonlinear methods.

Keywords: EEG; MEG; event-related connectivity; functional connectivity; multidimensional; nonlinear; semantic control; semantic representation.


Conflict of interest statement

The authors declare that the research was conducted in the absence of any commercial or financial relationships that could be construed as a potential conflict of interest.

Figures

Figure 1
Figure 1
Illustration of linear and nonlinear time-lagged multidimensional pattern connectivity approaches. (a) The principle of TL-MDPC is displayed. We assess the relationship between activity patterns in ROI X and ROI Y at different time lags. Each matrix indicates activity patterns in one ROI at one time point, with rows in each matrix indicating activation across different trials, and columns representing activation over different vertices in the ROI. Bidirectional arrows represent possible transformations and dependencies between patterns. (b) Illustration of using TL-MDPC to detect the linear transformations T between patterns using ridge regression (as in Rahimi et al., 2023). (c) Illustration of the novel nTL-MDPC method to detect nonlinear (and linear) transformations between patterns using an artificial neural network.
Figure 2
Figure 2
Representation of the three simulation scenarios designed to test accurate detection of different types of multidimensional connectivity. The matrices ( X and Y ) show patterns of responses in ROI X and ROI Y, respectively, with rows indicating different trials and columns indicating vertices. (a) In this scenario, X and Y are independent patterns with no reliable transformation between the regions, and as a result, no connectivity should be identified. (b) Here, there is a linear multidimensional relationship between X and Y through matrix T . (c) In the final scenario, nonlinear multidimensional relationships between X and Y are simulated through a neural network transformation. Patterns in ROI X are first transformed linearly through T0 , then passed through a nonlinear (sigmoid or tangent hyperbolic) function f(.) , and the resulting patterns again transformed through T1 to produce the patterns in ROI Y.
Figure 3
Figure 3
Connectivity values (explained variance, y-axis) for two independent patterns. (a) Connectivity for (linear) MDPC as a function of different numbers of trials, with different curves representing different combinations of numbers of vertices in ROI X and ROI Y. (b) Similar to (a), but for nMDPC. The values are close to zero indicating that neither MDPC nor nMDPC methods are prone to false positive errors for random patterns. Note that while all EVs and their means were positive (as negative EVs were replaced by zeros), error bars based on standard deviations can still extend below zero.
Figure 4
Figure 4
Connectivity metrics for linear multidimensional effects assessed using MDPC and nMDPC. Connectivity metrics for linear multidimensional effects assessed using MDPC and nMDPC for three different numbers of vertices: (a) (X, Y) = (5, 5), (b) (X, Y) = (5, 15), and (c) (X, Y) = (15, 15). All panels show connectivity scores (explained variance, y-axis) between patterns that have a true linear multidimensional dependency, for different SNRs (x-axis), numbers of trials (MDPC approach: red curves, nMDPC approach: blue curves), and number of vertices (three panels). All cases show that EV reaches values above 0.8 for SNRs above 25 db, and is close to zero for SNRs smaller than −10 db. In all panels, both linear and nonlinear MDPC show similar results, with MDPC producing greater EV.
Figure 5
Figure 5
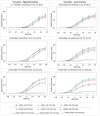
Connectivity metrics for nonlinear multidimensional effects using MDPC and nMDPC. (a,c,e) Connectivity scores (explained variance, y-axis) between patterns with nonlinear multidimensional dependency, for different SNRs (x-axis), three different numbers of trials (MDPC approach: red curves, nMDPC approach: green curves) and different number of vertices (three panels), using sigmoid as the activation function. (b,d,f) Same as (a,c,e) but with a tangent hyperbolic activation function. Linear MDPC provides a good approximation to the nonlinear scenarios in most cases, and even performs slightly better than nMDPC for low number of trials and large number of vertices. However, nMDPC generally explains some additional variance, particularly for larger numbers of trials (e.g., a trials-to-vertex ratio ≥ 10:1).
Figure 6
Figure 6
An example of TTMs showing the connectivity between PTC (y-axis) and IFG (x-axis), for the semantic decision (SD) task (the left column), the lexical decision (LD) task (the middle column), and their comparison (i.e., connectivity that is greater when there are greater semantic demands; right column). (a) TTMs for TL-MDPC, (b) TTMs for nTL-MDPC. Colour bars show connectivity scores (explained variance) for the first two left columns. For the third column, the hot and cold colour bar highlights significant effects obtained from the cluster-based permutation test, whereas the grey-scale colour bar shows non-significant t-values (this colour bar is the same across all figures). With both methods, the greatest connectivity occurs around the diagonal; however, the statistical comparison between the tasks reveals more reliable modulation of connectivity in the nTL-MDPC case, particularly at later latencies and time lags. Note that this does not necessarily reflect a significant difference between the connectivity identified using the two methods (see below).
Figure 7
Figure 7
Inter-regional Connectivity Matrix (ICM) for semantic network modulations in the brain—the upper diagonal (green shaded area) shows nTL-MDPC TTMs and the lower diagonal (blue shaded area) shows TL-MDPC TTMs. Each TTM reflects EVs for a pair of regions, ROI X and ROI Y, and across time. All modulations with both methods showed greater connectivity for SD than LD. Cluster size was thresholded at 2% of TTM’s size (24*24). Using both methods, we found rich modulations between semantic control and representation regions. The hot and cold colour bar highlights significant effects obtained from the cluster-based permutation test, whereas the grey-scale colour bar shows non-significant t-values. The colour bars are the same across all figures. There were no significant differences between the results for the two methods.
Figure 8
Figure 8
Summary of our cortical functional connectivity analyses of EEG/MEG data using four different connectivity approaches. (a) Networks extracted for an early time window (0–250 ms), through (1) coherence (Rahimi et al., 2022), (2) the UDC method (Rahimi et al., 2023), (3) MDPC (Rahimi et al., 2023), and (4) nMDPC. (b) Same as (a), but for a late time window (250–500 ms). For coherence, the blue connections represent dependencies specific to the gamma band, and yellow ones show the connections consistent across the alpha, beta, and gamma bands. For the other three methods, arrows represent the summed significant t-values in each time window as a metric of connection intensity, with thicker arrows reflecting more intense connections (higher summed t-values) and vice versa. Overall, TL-MDPC reveals more connections compared to the two unidimensional methods, but TL-MDPC and nTL-MDPC produced the same pattern of connectivity with very few differences.

Similar articles

References

    1. Anzellotti S., Caramazza A., Saxe R. (2017a). Multivariate pattern dependence. PLoS Comput. Biol. 13:e1005799. doi: 10.1371/journal.pcbi.1005799, PMID: - DOI - PMC - PubMed
    1. Anzellotti S., Coutanche M. N. (2018). Beyond functional connectivity: investigating networks of multivariate representations. Trends Cogn. Sci. 22, 258–269. doi: 10.1016/j.tics.2017.12.002, PMID: - DOI - PubMed
    1. Anzellotti S., Fedorenko E., Kell A. J. E., Caramazza A., Saxe R. (2017b). Measuring and modeling nonlinear interactions between brain regions with fMRI. bioRxiv [Preprint]. bioRxiv: 74856
    1. Arinyo-i-Prats R., López-Madrona V. J., Paluš M. (2024). Lead/Lag directionality is not generally equivalent to causality in nonlinear systems: Comparison of phase slope index and conditional mutual information. NeuroImage. 292:120610., PMID: - PubMed
    1. Basti A., Mur M., Kriegeskorte N., Pizzella V., Marzetti L., Hauk O. (2019). Analysing linear multivariate pattern transformations in neuroimaging data. PLoS One 14:660. doi: 10.1371/journal.pone.0223660, PMID: - DOI - PMC - PubMed

LinkOut - more resources