

Causal Central Network Remodeling in Diabetic Neuropathy: An Integrated MR-fMRI Study
- PMID: 40808862
- PMCID: PMC12345936
- DOI: 10.2147/DMSO.S525219
Causal Central Network Remodeling in Diabetic Neuropathy: An Integrated MR-fMRI Study
Abstract
Purpose: Diabetic peripheral neuropathy (DPN) is traditionally viewed as a peripheral disorder, yet emerging evidence implicates central nervous system (CNS) network dysfunction in its pathogenesis, though causal mechanisms remain incompletely understood.
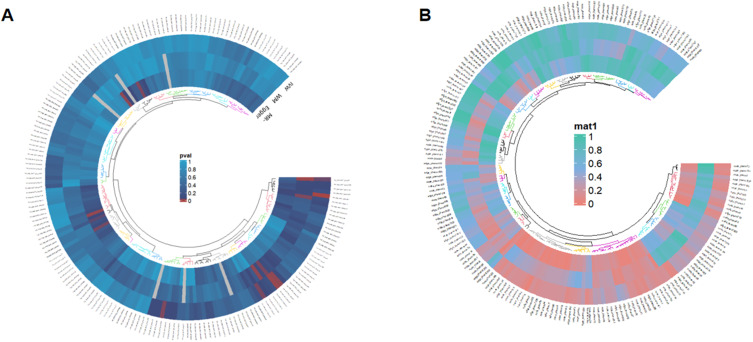
Methods: Bidirectional two-sample Mendelian randomization (MR) analysis examined causal relationships between Resting-State Functional Magnetic Resonance Imaging (rs-fMRI) phenotypes (n=34,691) and DPN (n=96,474). For validation, amplitude of low-frequency fluctuation (ALFF) and functional connectivity (FC) analyses were conducted using rs-fMRI scans from DPN patients (n=16), diabetic controls without DPN (NDPN, n=24), and healthy controls (HC, n=20).
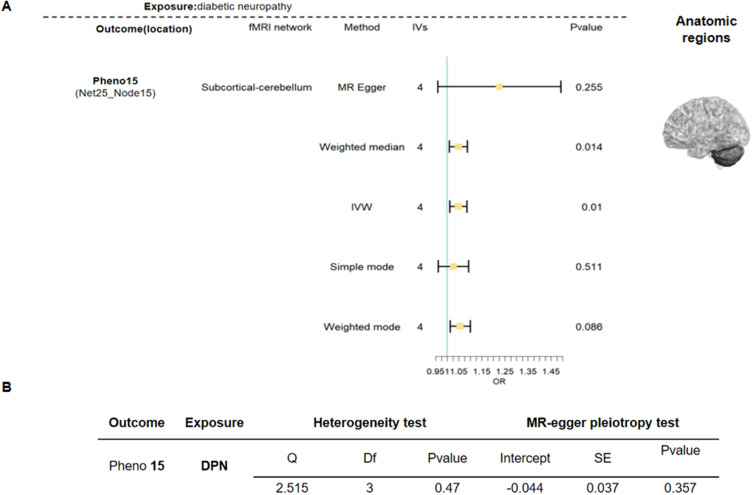
Results: Bidirectional MR demonstrated that: (a) reduced default mode-visual network connectivity causally elevates DPN risk (OR=0.61, P=0.04); (b) DPN promotes subcortical-cerebellar hyperconnectivity (OR=1.04, P=0.01). DPN patients exhibited significantly higher age, triglyceride levels, pain scores, and cognitive impairment relative to comparison groups (all P<0.001). Neuroimaging identified increased ALFF in the left superior frontal gyrus (LSFG) (AUC=0.79, P<0.05), which correlated positively with disease duration, accompanied by decoupled FC with the lingual gyrus but enhanced FC with the precuneus.
Conclusion: This study establishes DPN as a CNS-periphery integrated network disorder: genetic drivers disrupt default mode-visual integration, while compensatory subcortical-cerebellar hyperconnectivity stabilizes motor function via adaptive mechanisms. The LSFG emerges as a neuroadaptive hub, where elevated ALFF and connectivity reorganization (↓lingual gyrus/↑precuneus) reflect dynamic rebalancing between impaired basic vision and enhanced visuospatial processing. These findings redefine DPN pathogenesis beyond pure peripheral neurodegeneration, providing a theoretical foundation for early detection and circuit-targeted neuromodulation therapies.
Keywords: Mendelian random analysis; diabetic peripheral neuropathy; fMRI; low-frequency fluctuations; type 2 diabetes mellitus.
© 2025 Li and Gao.
Conflict of interest statement
The authors report no conflicts of interest in this work.
Figures


Similar articles
-
Morphological analysis and functional connectivity of the insular in patients with dysphagia after cerebral infarction based on resting-state fMRI.BMC Neurol. 2025 Jul 30;25(1):307. doi: 10.1186/s12883-025-04322-1. BMC Neurol. 2025. PMID: 40739609 Free PMC article.
-
Prescription of Controlled Substances: Benefits and Risks.2025 Jul 6. In: StatPearls [Internet]. Treasure Island (FL): StatPearls Publishing; 2025 Jan–. 2025 Jul 6. In: StatPearls [Internet]. Treasure Island (FL): StatPearls Publishing; 2025 Jan–. PMID: 30726003 Free Books & Documents.
-
Brain functional alterations in early stage of coal workers' pneumoconiosis with alcoholism: insights from a resting-state fMRI investigation.Front Neurosci. 2025 Jun 16;19:1610657. doi: 10.3389/fnins.2025.1610657. eCollection 2025. Front Neurosci. 2025. PMID: 40589788 Free PMC article.
-
Association Between Tumor Necrosis Factor-α and Diabetic Peripheral Neuropathy in Patients with Type 2 Diabetes: a Meta-Analysis.Mol Neurobiol. 2017 Mar;54(2):983-996. doi: 10.1007/s12035-016-9702-z. Epub 2016 Jan 21. Mol Neurobiol. 2017. PMID: 26797519
-
Oxcarbazepine for neuropathic pain.Cochrane Database Syst Rev. 2017 Dec 2;12(12):CD007963. doi: 10.1002/14651858.CD007963.pub3. Cochrane Database Syst Rev. 2017. PMID: 29199767 Free PMC article.
References
LinkOut - more resources
Full Text Sources
