

Identifying inflammatory bowel disease subtypes: a comprehensive exploration of transcriptomic data and machine learning-based approaches
- PMID: 40808866
- PMCID: PMC12344326
- DOI: 10.1177/17562848251362391
Identifying inflammatory bowel disease subtypes: a comprehensive exploration of transcriptomic data and machine learning-based approaches
Abstract
Background: Inflammatory bowel disease (IBD), encompassing Crohn's disease (CD) and ulcerative colitis (UC), is a heterogeneous condition characterised by chronic gastrointestinal inflammation and dysregulated immune responses. Despite advances in transcriptomic analysis and machine learning (ML), consistent molecular subtyping across datasets remains a challenge. There is a critical need for robust subtypes that reflect disease heterogeneity and correlate with clinical outcomes.
Objectives: Unlike prior studies focused on either UC or CD or based on small datasets, this study analyses a large-scale RNA sequencing (RNA-seq) dataset to identify transcriptomic subtypes in both UC and CD.
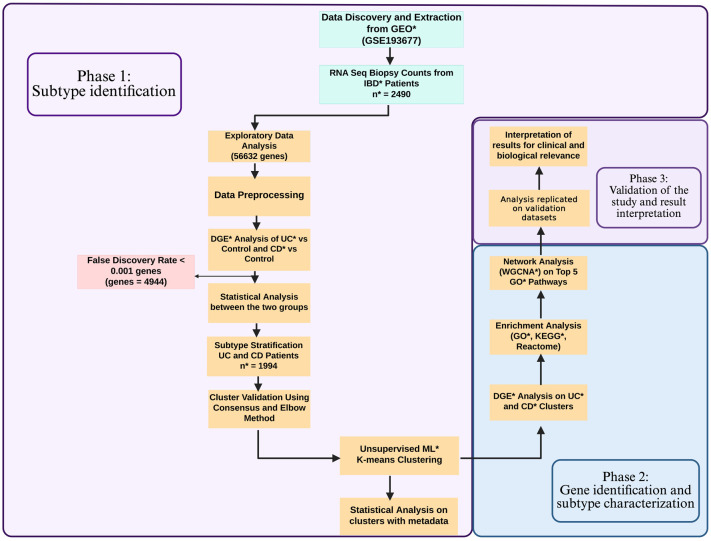
Design: We analysed RNA-seq data from four prospective cross-sectional cohorts from Gene Expression Omnibus: GSE193677, GSE186507, GSE137344 and GSE235236.
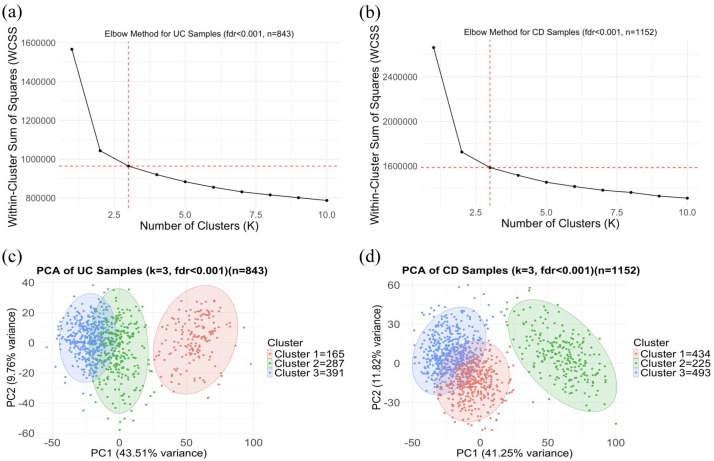
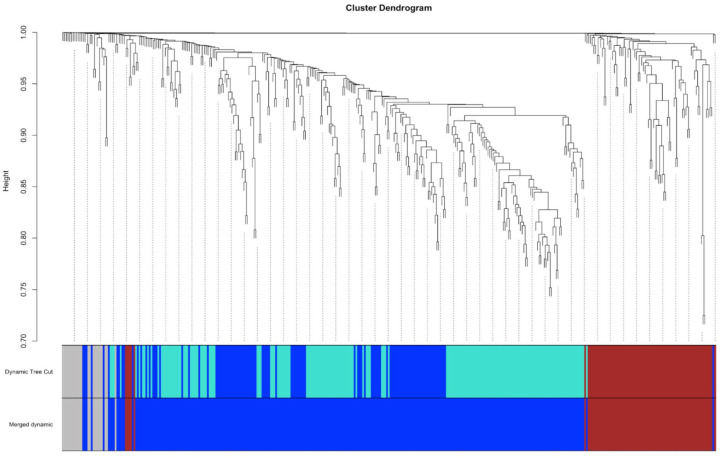
Methods: Analysed RNA-sequenced data from inflamed and non-inflamed intestinal biopsies of 2490 adult IBD patients. K-means clustering was applied independently to UC and CD samples to identify transcriptomic clusters. Gene set enrichment and network analyses explored molecular characteristics. Associations with clinical metadata, including disease severity and anatomical involvement, were assessed using Chi-square and analysis of variance tests.
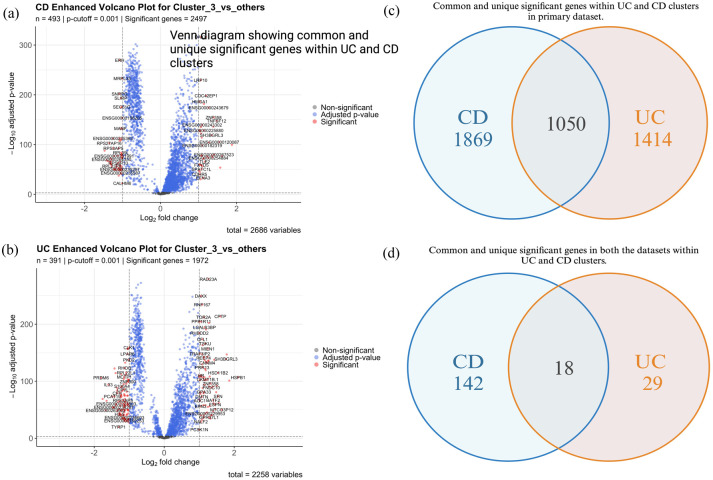
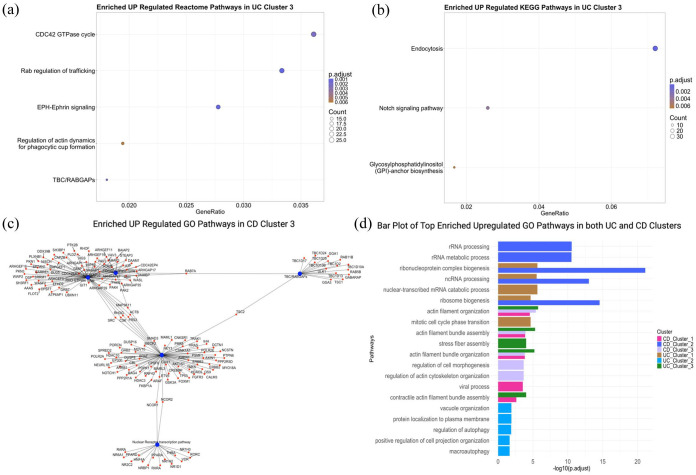
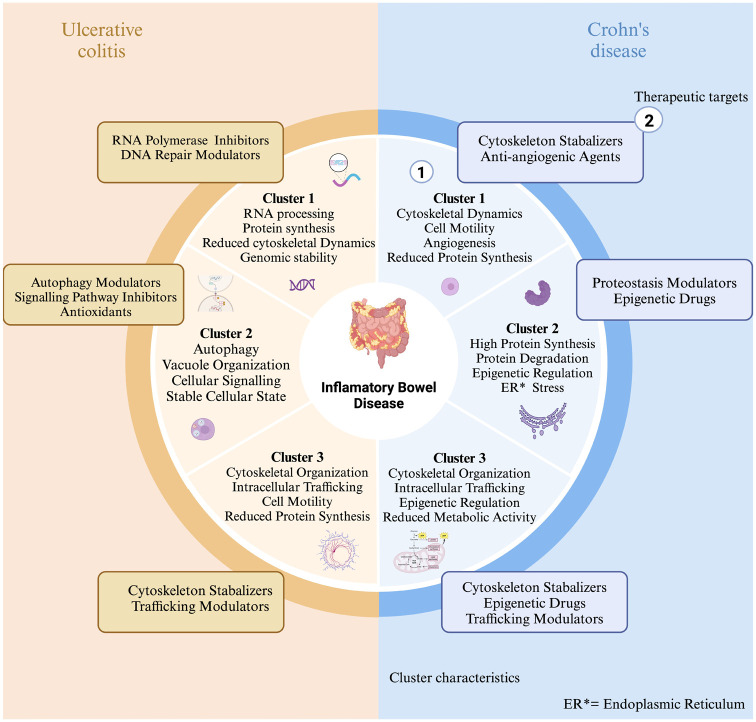
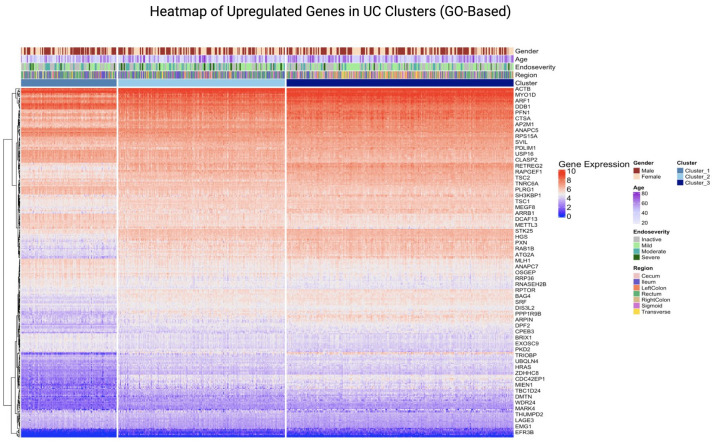
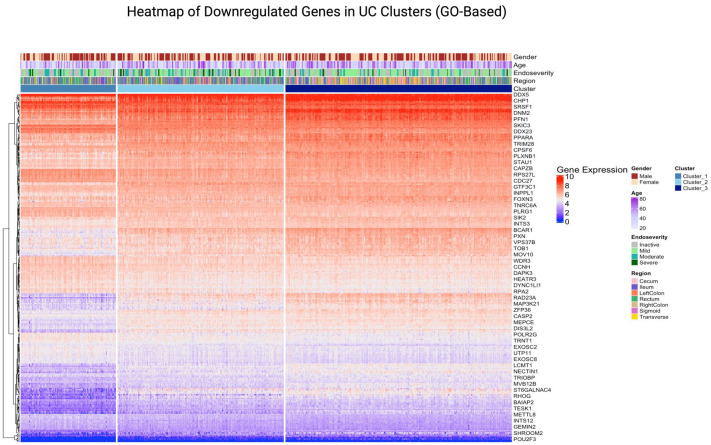
Results: K-means clustering revealed three distinct transcriptomic subtypes in both UC and CD. In UC, Cluster 1 was enriched for RNA processing and DNA repair genes; Cluster 2 highlighted autophagy, stress responses and upregulation of ATG13, VPS37C and DVL2; Cluster 3 emphasised cytoskeletal organisation (SRF, SRC and ABL1). In CD, Cluster 1 featured cytoskeletal remodelling and suppressed protein synthesis (CFL1, F11R and RAD23A), while Cluster 2 upregulated stress and translation pathways. Cluster 3 again prioritised cytoskeletal structure over metabolic activity. Cluster 3 in both conditions was significantly associated with moderate-to-severe endoscopic activity; Cluster 1 was enriched in inactive or mild disease.
Conclusion: We report three transcriptomic subtypes in UC and CD, each with distinct molecular signatures and clinical relevance. These findings support a stratified approach to IBD diagnosis and therapy, enabling more personalised disease management strategies.
Keywords: Crohn’s disease; IBD subtypes; machine learning; transcriptomics; ulcerative colitis.
Plain language summary
Identification of the IBD subtype using machine learning Inflammatory Bowel Disease (IBD) is a complex gastrointestinal disorder affecting millions worldwide. This groundbreaking study analyzed RNA sequencing data from 2490 adult patients, revealing three distinct molecular subtypes for both Ulcerative Colitis and Crohn’s Disease. By examining gene expression patterns in intestinal biopsies, researchers identified unique clusters characterized by different cellular processes like RNA processing, cytoskeletal dynamics, and stress responses. Each subtype showed specific gene upregulation and distinct molecular signatures. The research used Kmeans clustering and statistical analysis to link these subtypes with disease severity and regional variations. This innovative approach provides deeper insights into IBD’s molecular mechanisms, potentially paving the way for more personalized treatment strategies.
© The Author(s), 2025.
Figures
Similar articles
-
Impact of moderate-to-severe ulcerative colitis and Crohn's disease on sexual activity: United States and European patient perspectives from the communicating needs and features of IBD experiences (CONFIDE) survey.Curr Med Res Opin. 2025 Jun;41(6):1017-1030. doi: 10.1080/03007995.2025.2530736. Epub 2025 Jul 17. Curr Med Res Opin. 2025. PMID: 40635574
-
Helminth therapy (worms) for induction of remission in inflammatory bowel disease.Cochrane Database Syst Rev. 2014 Jan 20;2014(1):CD009400. doi: 10.1002/14651858.CD009400.pub2. Cochrane Database Syst Rev. 2014. PMID: 24442917 Free PMC article.
-
Interventions for the management of abdominal pain in Crohn's disease and inflammatory bowel disease.Cochrane Database Syst Rev. 2021 Nov 29;11(11):CD013531. doi: 10.1002/14651858.CD013531.pub2. Cochrane Database Syst Rev. 2021. PMID: 34844288 Free PMC article.
-
Ischemic Stroke May Increase the Risk of Crohn's Disease and Ulcerative Colitis: Evidence from a Bidirectional Mendelian Randomization Study.World Neurosurg. 2025 Apr;196:123718. doi: 10.1016/j.wneu.2025.123718. Epub 2025 Mar 13. World Neurosurg. 2025. PMID: 39929265
-
Vitamin D for the treatment of inflammatory bowel disease.Cochrane Database Syst Rev. 2023 Oct 2;10(10):CD011806. doi: 10.1002/14651858.CD011806.pub2. Cochrane Database Syst Rev. 2023. PMID: 37781953 Free PMC article.
References
-
- Kraneveld AD, Rijnierse A, Nijkamp FP, et al. Neuro-immune interactions in inflammatory bowel disease and irritable bowel syndrome: future therapeutic targets. Eur J Pharmacol 2008; 585: 361–374. - PubMed
Associated data
LinkOut - more resources
Full Text Sources
Miscellaneous
