. 2024 May 16;11(14):2400005.
doi: 10.1002/admi.202400005. Epub 2024 Mar 12.

An Advanced Healthcare Sensing Platform for Direct Detection of Viral Proteins in Seconds at Femtomolar Concentrations via Aerosol Jet 3D-Printed Nano and Biomaterials

Affiliations

An Advanced Healthcare Sensing Platform for Direct Detection of Viral Proteins in Seconds at Femtomolar Concentrations via Aerosol Jet 3D-Printed Nano and Biomaterials

Azahar Ali et al. Adv Mater Interfaces. .

Abstract

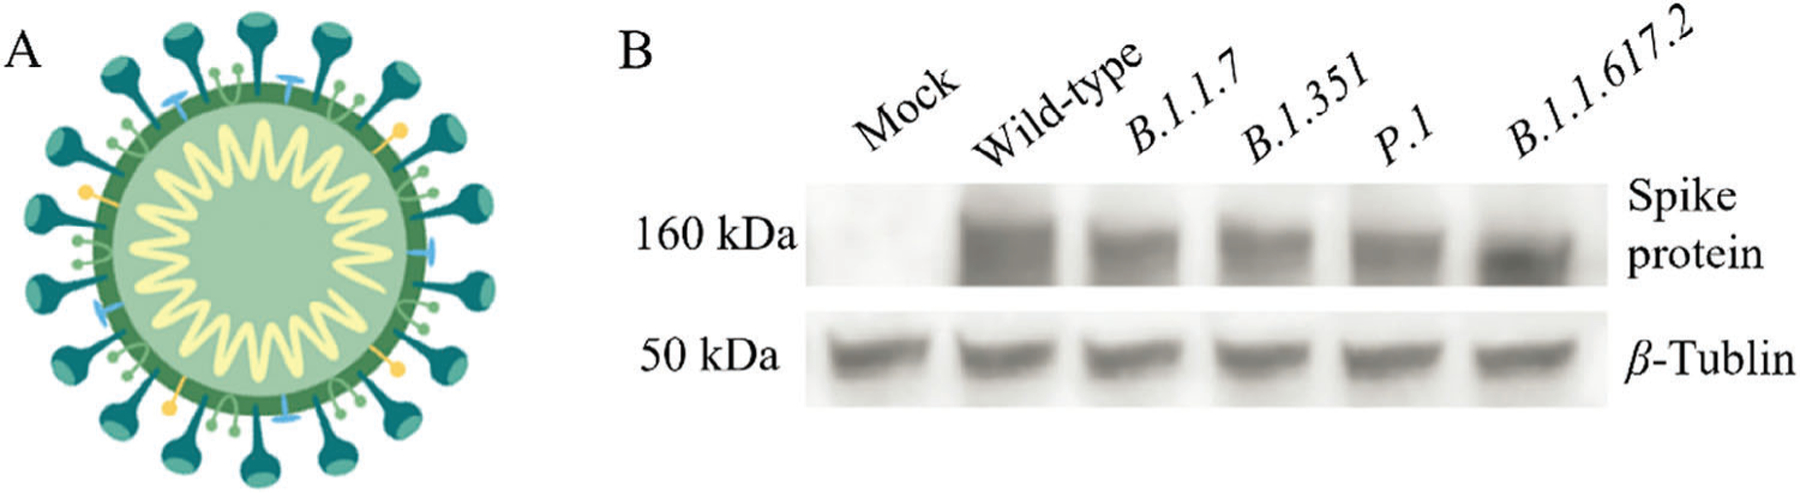
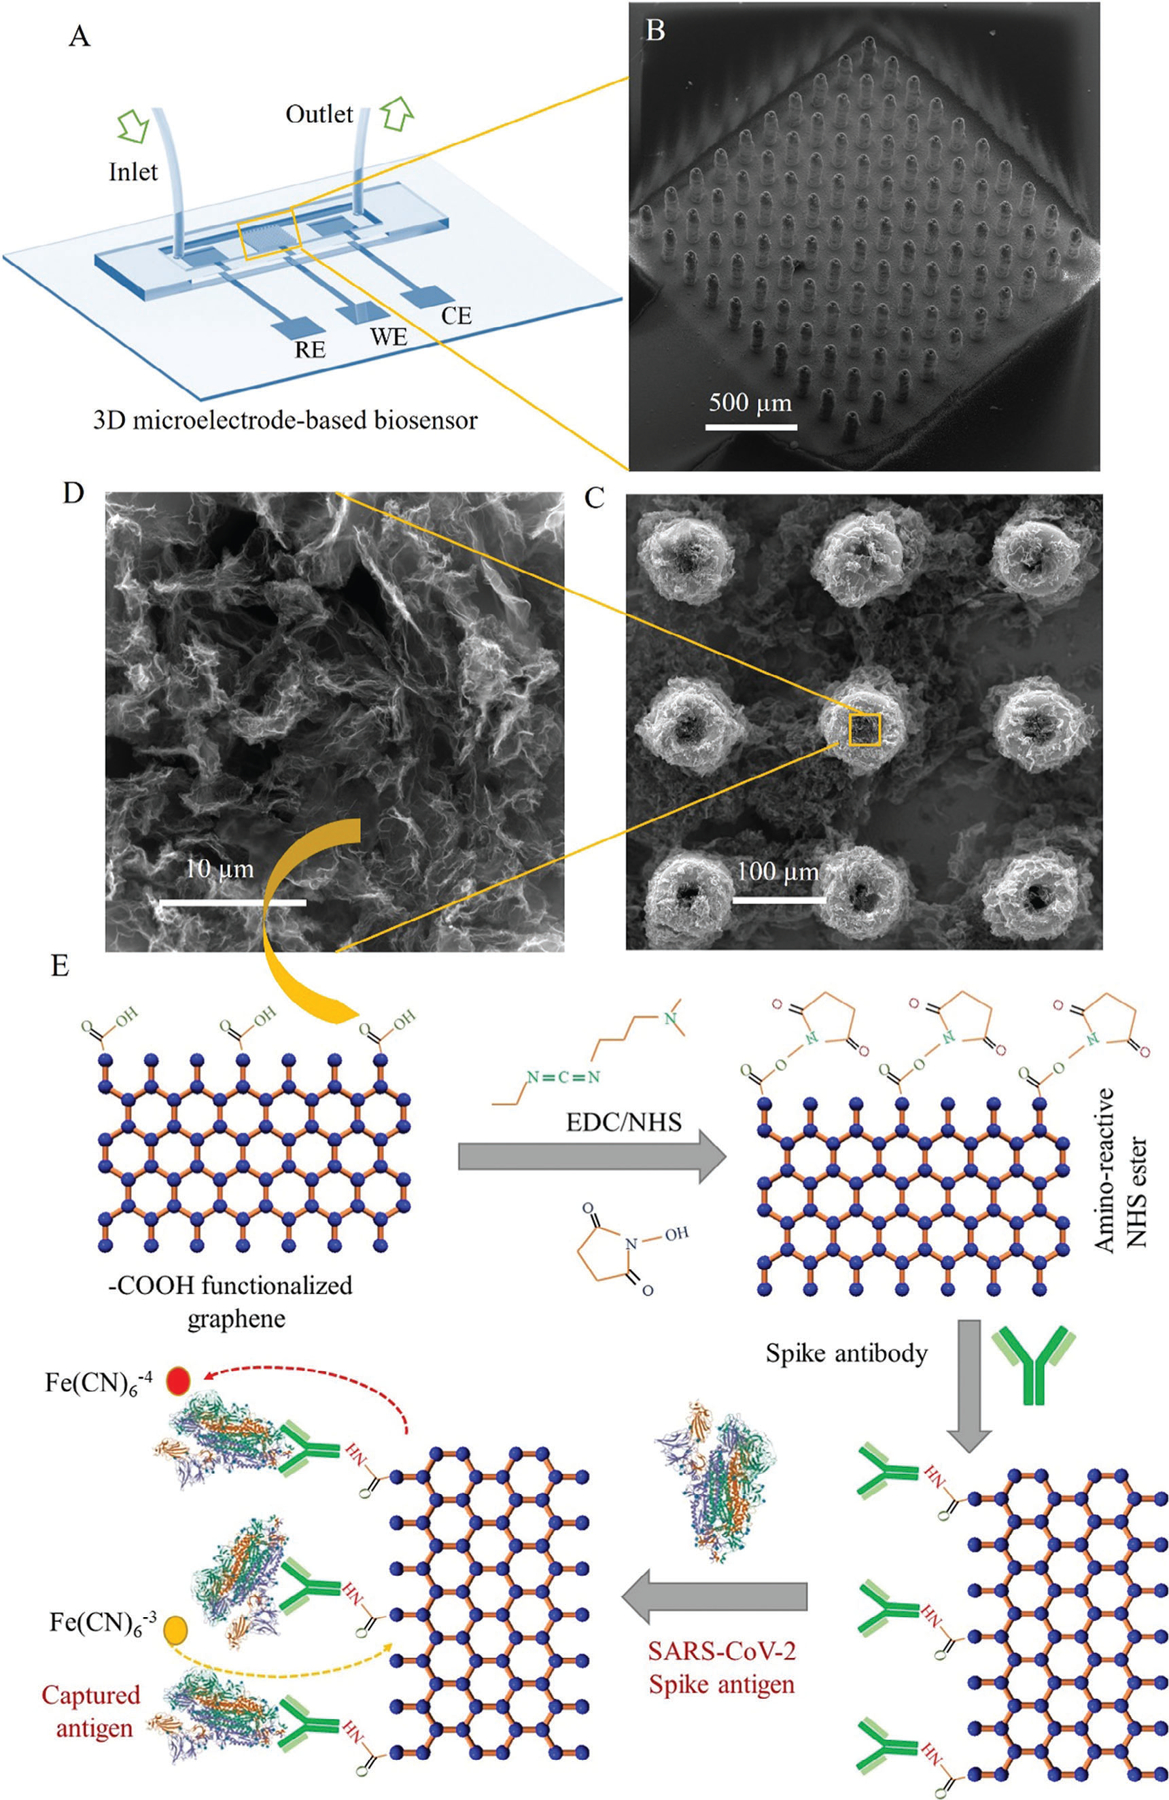
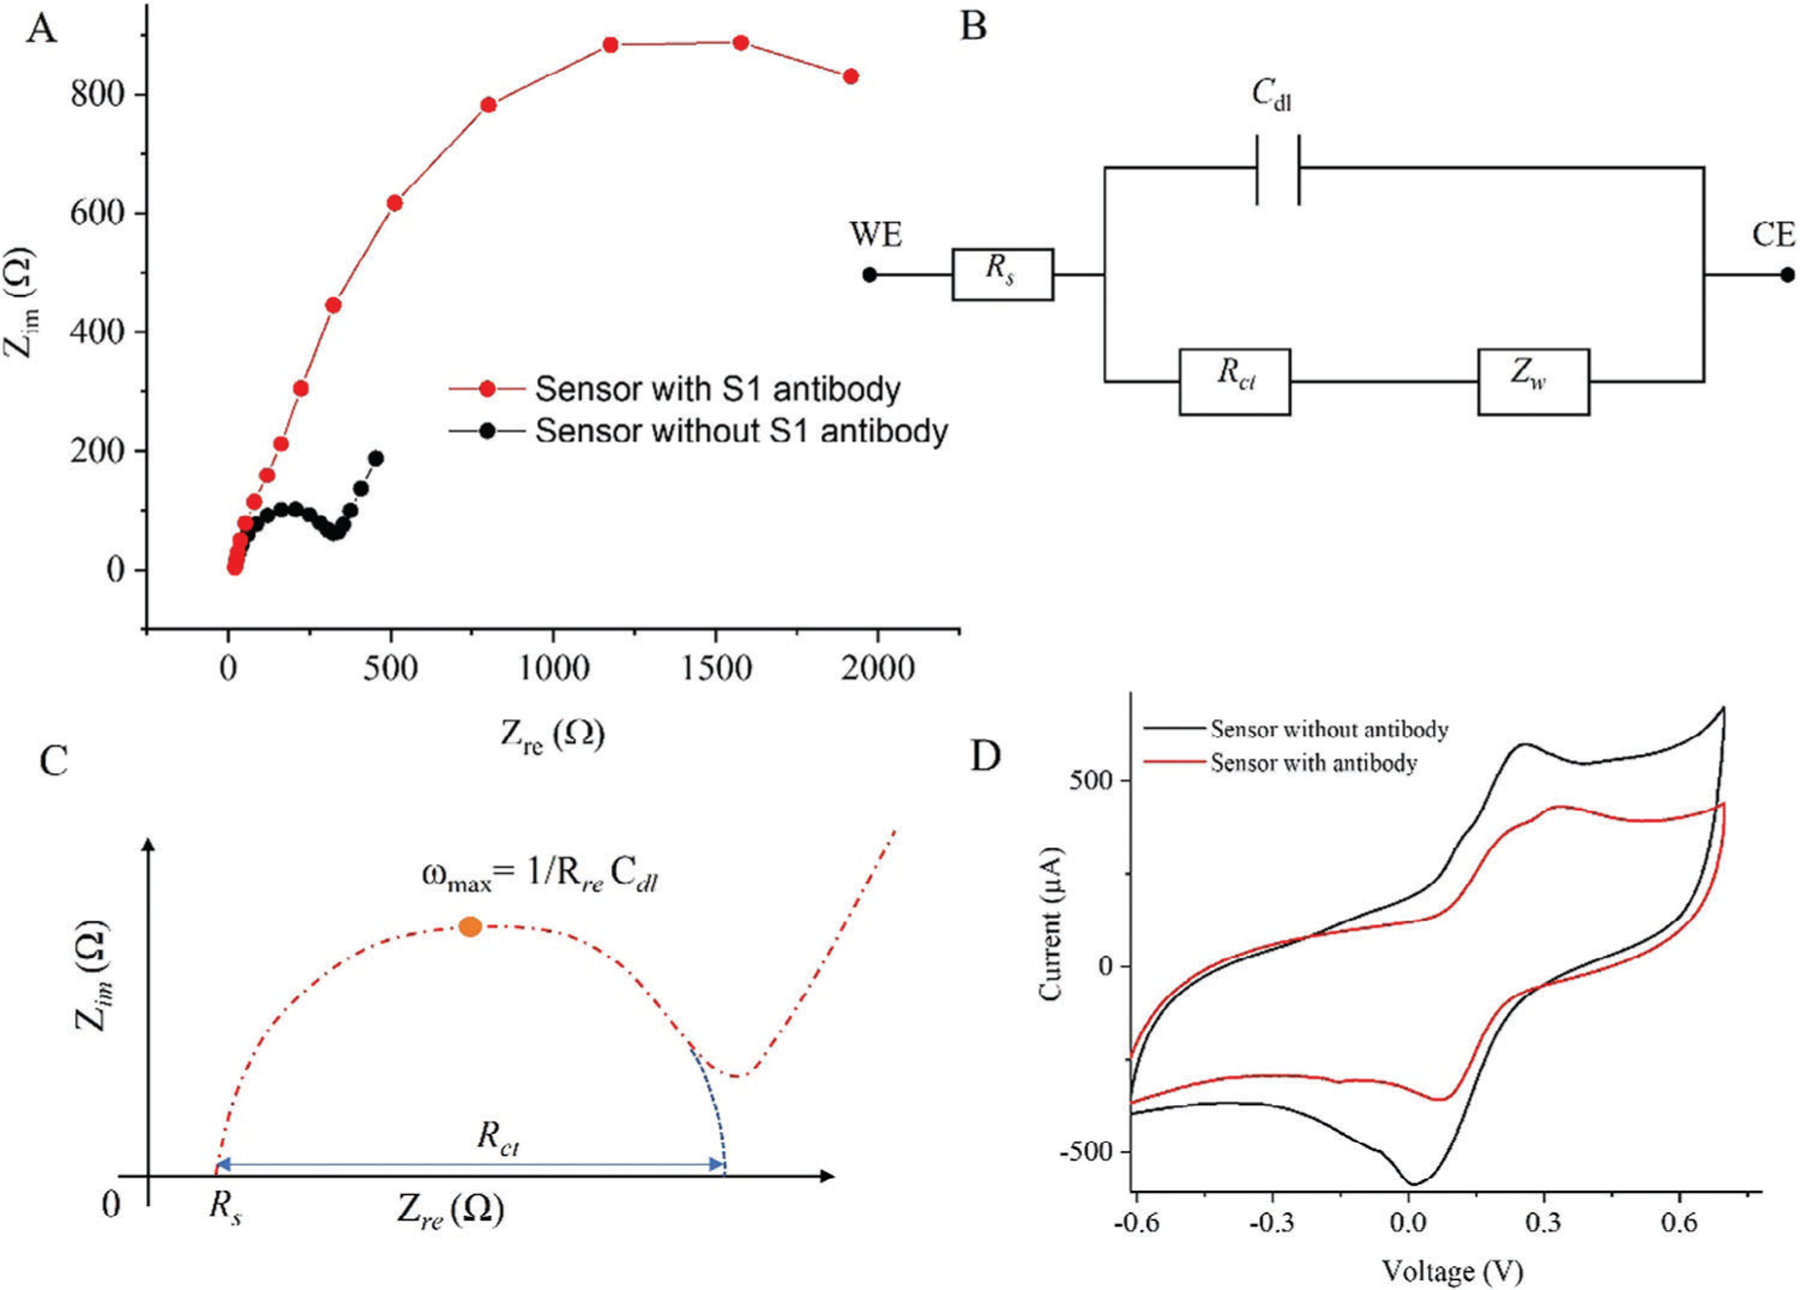
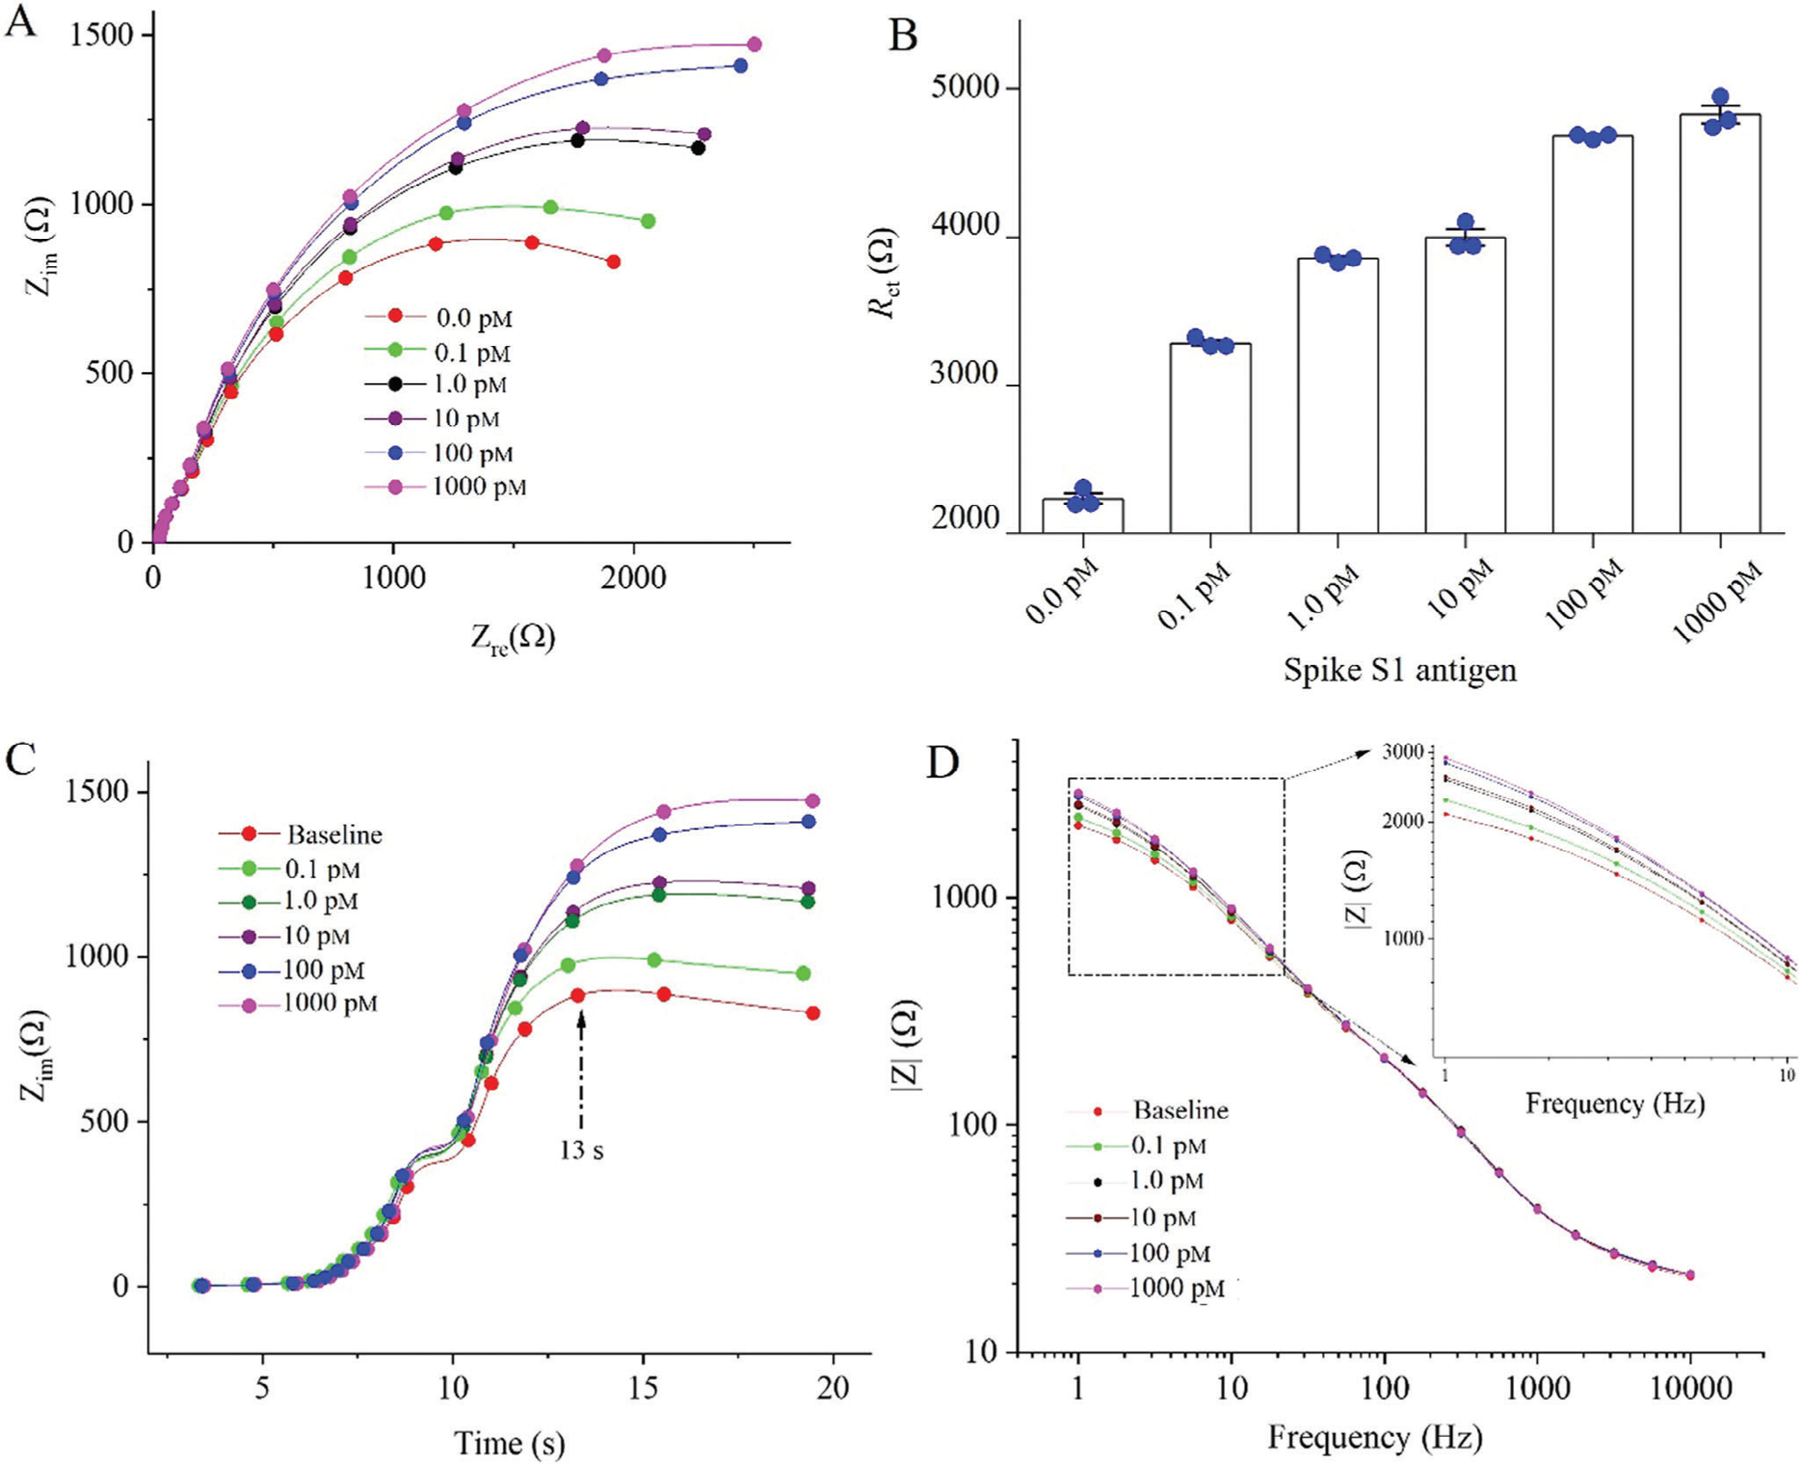
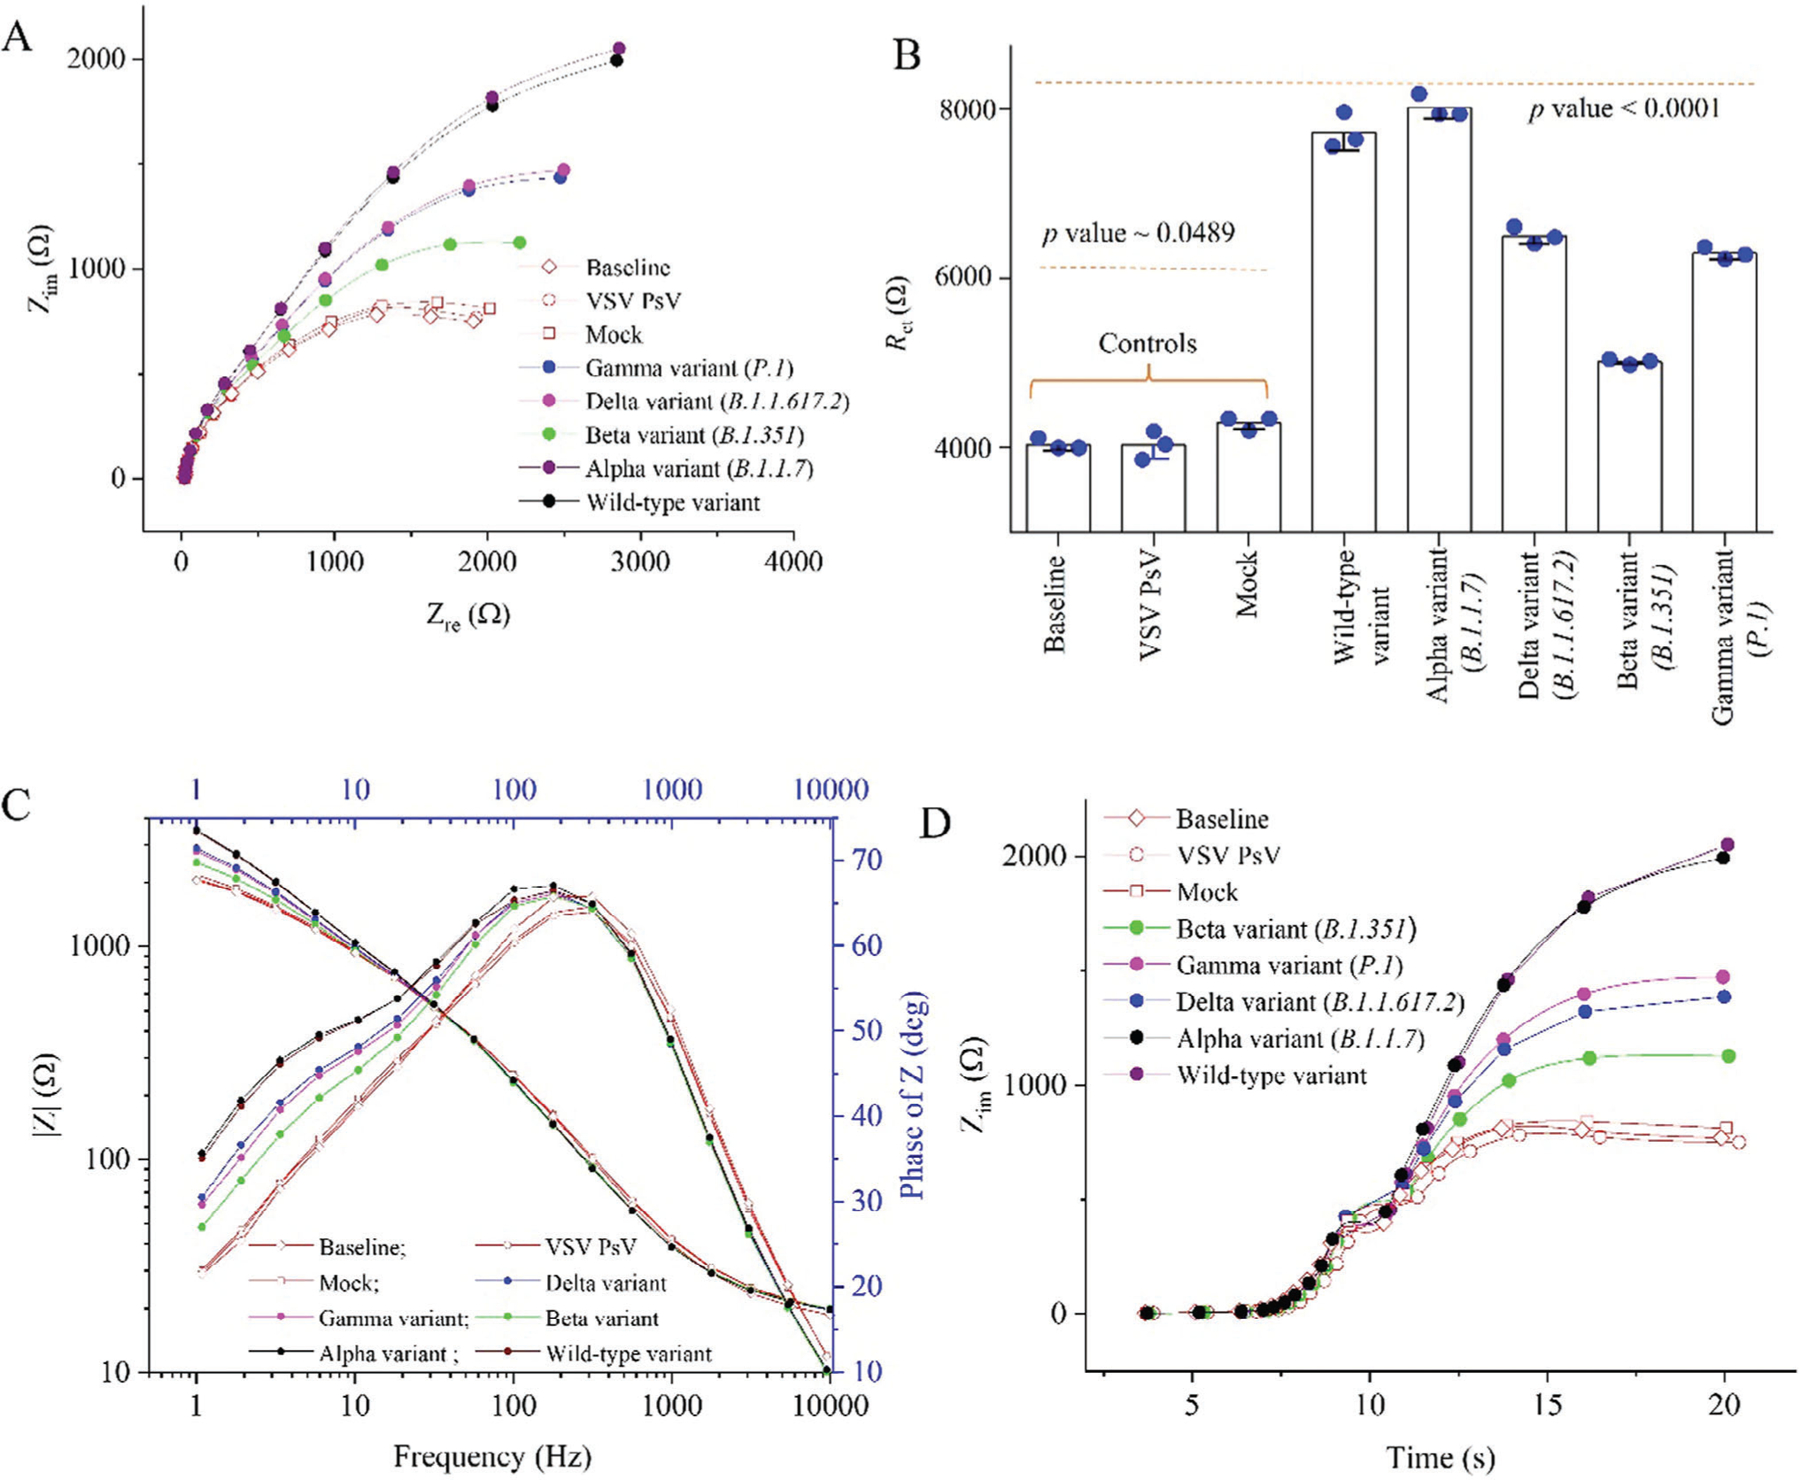
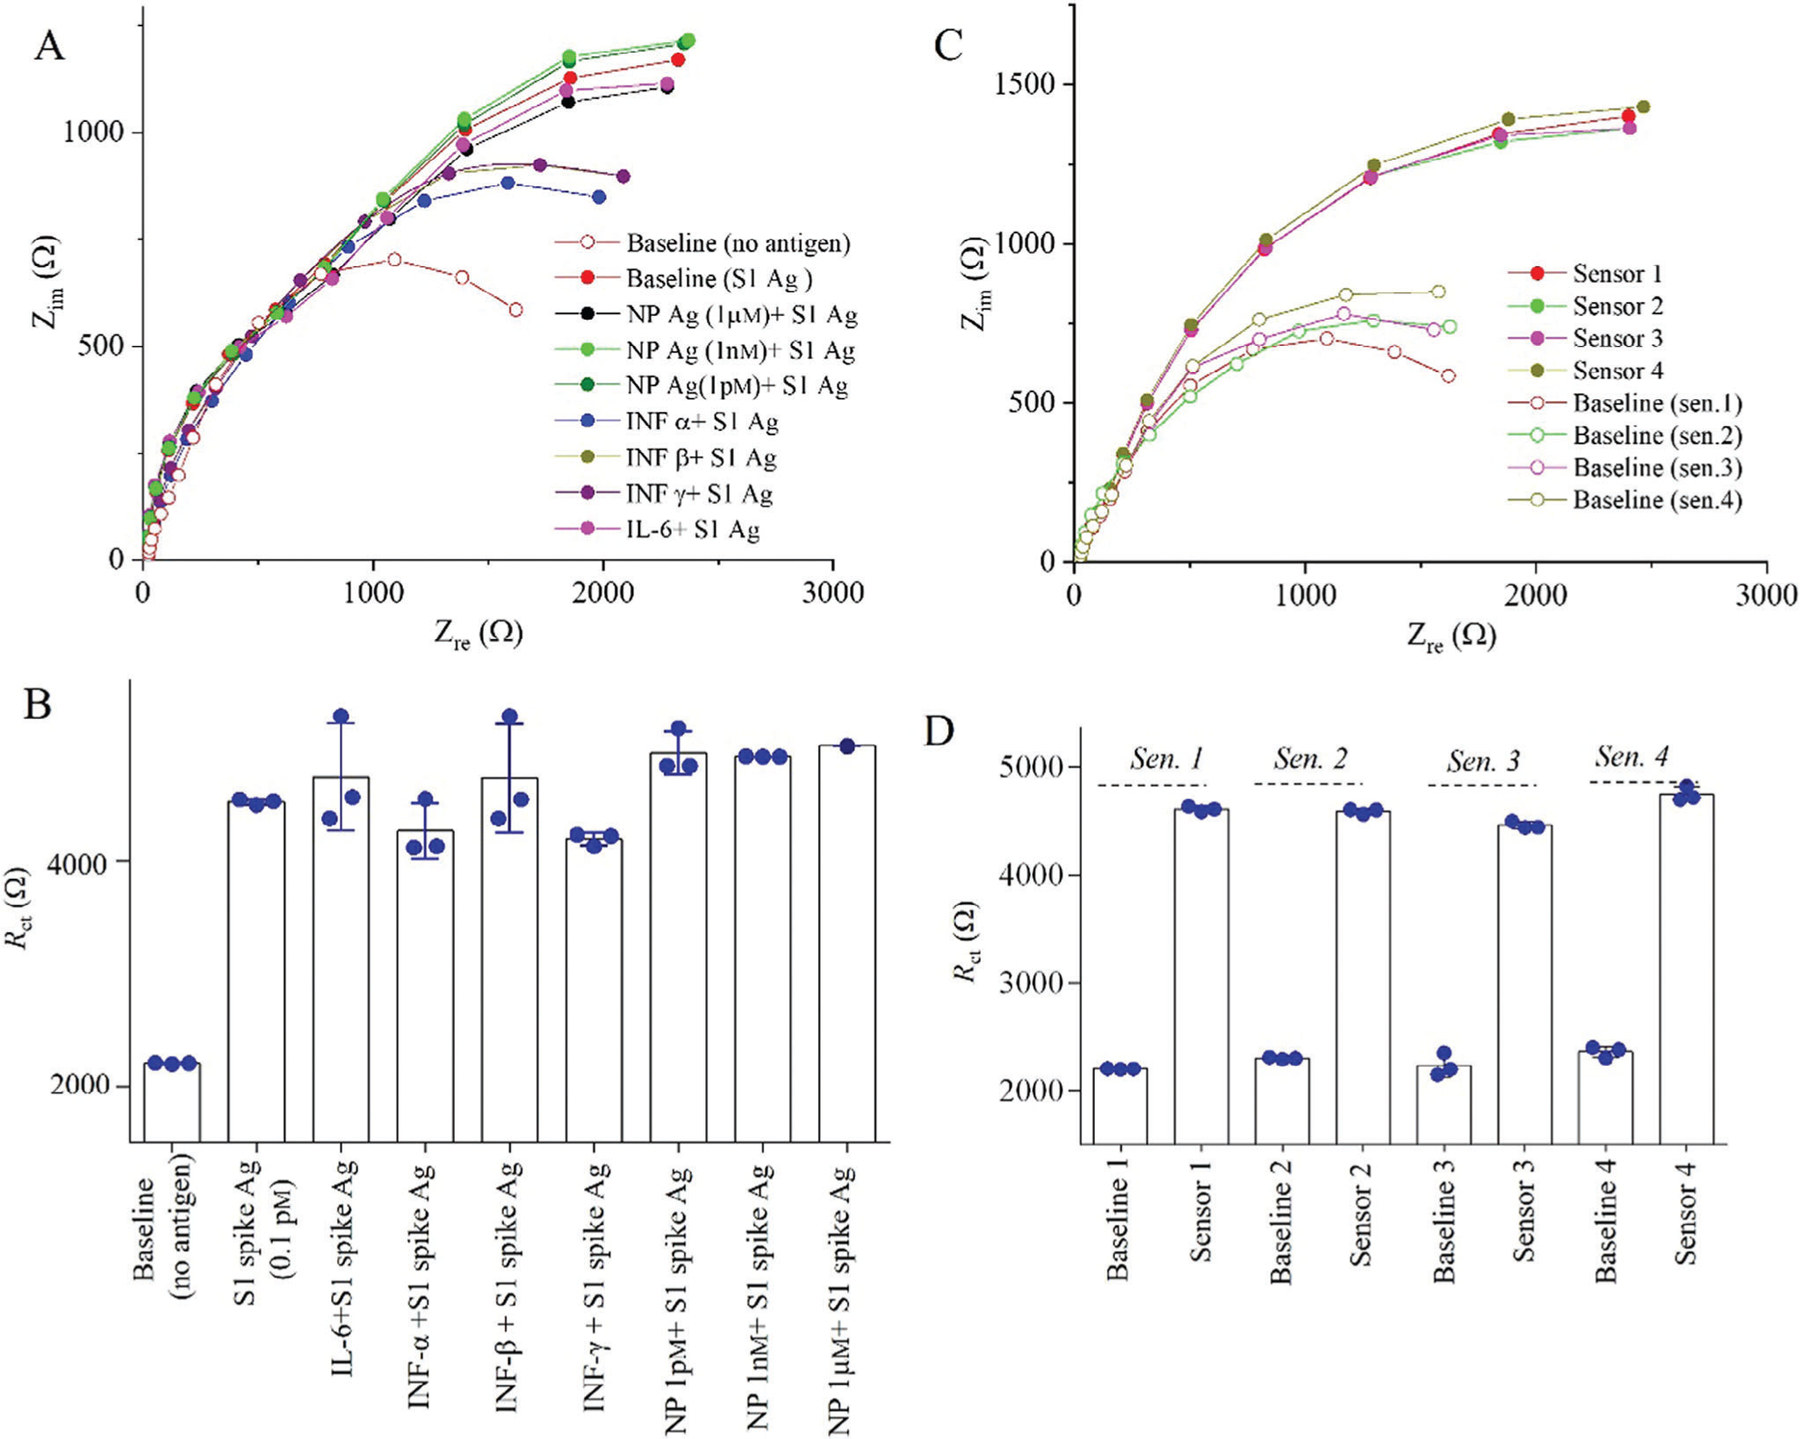
Sensing of viral antigens has become a critical tool in combating infectious diseases. Current sensing techniques have a tradeoff between sensitivity and time of detection; with 10-30 min of detection time at a relatively low sensitivity and 6-12 h of detection at a high (picomolar) sensitivity. In this research, uniquely nanoengineered interfaces are demonstrated on 3D electrodes that enable the detection of spike antigens of SARS-CoV-2 and their variants in seconds at femtomolar concentrations with excellent specificity, thus, overcoming this tradeoff. The 3D electrodes, manufactured using a high-resolution aerosol jet 3D nanoprinter, consist of a microelectrode array of sintered gold nanoparticles coated with graphene and antibodies specific to severe acute respiratory syndrome coronavirus-2 (SARS-CoV-2) spike antigens. An impedance-based sensing modality is employed to sense several pseudoviruses of SARS-CoV-2 variants of concern (VOCs). This device is sensitive to most of the pseudoviruses of SARS-CoV-2 VOCs. A high sensitivity of 100 fm, along with a low limit-of-detection of 9.2 fm within a test range of 0.1-1000 pm, and a detection time of 43 s are shown. This work illustrates that effective nano-bioengineering of interfaces can be used to create an ultrafast and ultrasensitive healthcare diagnostic tool for combating emerging infections.

Keywords: 3D biosensor; nano-bio-interfaces; nanoprinting; pseudovirus; ultrarapid diagnosis; variants of concern.


Conflict of interest statement

Conflict of Interest The authors declare no conflict of interest.

Figures

Figure 1.
Figure 1.
Packaging of pseudoviruses SARS-CoV-2 VOCs. A) Structure of SARS-CoV-2 and spike. B) The expression of SARS-CoV-2 spike proteins was confirmed by Western-blotting.
Figure 2.
Figure 2.
3D nano-printed sensor for rapid detection of SARS-CoV-2 VOCs. A) Schematic presentation of a 3D nano-printed sensor. The device consists of three electrodes such as working, counter, and reference wherein the working electrode was made of an array of micropillars of gold nanoparticles. This array was manufactured by an Aerosol Jet 3D nanoparticle printer. B) SEM image of the nano-printed micropillar array. C,D) SEM images of graphene coating on the gold microelectrode array (graphene-Au). The zoomed-in SEM image (D) shows the assembly of wrinkled graphene on the tip of a micropillar. E) Stepwise representation of the surface functionalization to coat the SARS-CoV-2 spike S1 antibodies on rGO-Au via a unique EDC-NHS conjugation chemistry. In reaction chemistry, the EDC activates the -COOH groups of graphene, while NHS acts as a stabilizer. The amide bonds were formed between spike S1 antibodies and the graphene-Au surface. Captured antigens by antibodies specific to SARS-CoV-2 spike proteins on the rGO-Au microelectrode hinder the electron transfer due to oxidation, thus enhancing the electrode impedance.
Figure 3.
Figure 3.
Sensor characterization. A) Electrochemical impedance spectroscopy (EIS) measurements show the Nyquist plots of the sensor. The sensor’s electrode (rGO-Au) was functionalized with SARS-CoV-2 spike S1 antibodies before and after measurements. B) Schematic illustration of an equivalent circuit between the counter and working electrodes. Rct is the charge transfer resistance, Rs is the solution resistance, Cdl is double-layer capacitance and Zw is the Warburg resistance. C) The diameter of the semicircle shown in a typical Nyquist plot is the Rct. An AC signal with an amplitude of 1.0 mV and a fixed frequency range (10 000–1 Hz) was applied to conduct the EIS experiments. D) The cyclic voltammetry (CV) of the sensor was conducted with and without spike S1 antibodies. With antibody coating, the sensor current is decreased due to blocking of electrons by antibodies on the electrode surface. Both EIS and CV measurements were performed in presence of PBS (50 mm) mixed with a ferro/ferricyanide (5 mm) redox mediator.
Figure 4.
Figure 4.
SARS-CoV-2 sensor calibration studies. A) Sensing results with different concentrations of SARS-CoV-2 spike S1 antigens. Sensing of SARS-CoV-2 antigens was conducted using EIS measurements. The Nyquist plots of the SARS-CoV-2 antigen sensor (A) were recorded as a function of S1 antigen at 0.1–1000 pm. B) Their corresponding Rct values are plotted with respect to the different S1 antigen concentrations. In Nyquist plots, the deviation of fitted (shown in Figure 3C) and raw semicircles was less than ±3.0%. A p-value of <0.0001 indicates a statistically significant difference (B). C) Imaginary impedances (Zim) of the sensors at different antigen concentrations were plotted against detection time in seconds. D) Modulus of impedance (|Z|) is plotted against frequency at different concentrations. Three repeated measurements were recorded for each antigen concentration. All EIS experiments for sensing antigens were recorded by applying an AC signal with an amplitude of 1 mV and a frequency range of 10 000–1 Hz. The PBS (50 mm) solution mixed with a ferro/ferricyanide (5 mm) mediator was used to prepare the titrate concentration of spike S1 antigens.
Figure 5.
Figure 5.
Sensing of SARS-CoV-2 VOCs. Based on titration measurements in Figure 4, the sensor was used to measure SARS-CoV-2 VOCs at identical conditions. A) The preparation of different SARS-CoV-2 pseudoviruses is demonstrated in Figure 1 and tested with the sensor using EIS measurement. For this study, VSV and Mock are taken as controls. WT, Alpha, Beta, Delta and Gamma are the five VOCs used in this study. B) Corresponding Rct values are calculated for both controls and VOCs and plotted to evaluate p-value (<0.0001). For each virus and control, the sensor was run at least three repeated times. C) The detection phase and modulus of impedance are plotted with frequency for each EIS measurement. D) The Zim of the sensors for detecting different VOCs were plotted against detection time in seconds. EIS measurements for sensing antigens were recorded by applying an AC signal with an amplitude of 1 mV and a frequency range of 10 000–1 Hz. The PBS (50 mm) solution mixed with a ferro/ferricyanide (5 mm) was used to prepare different concentrations of recombinant spike S1 antigens.
Figure 6.
Figure 6.
Sensor selectivity and reproducibility. The selectivity studies of the sensor is in presence of different antigens such as IFNs, IL-6, and NC with and without SARS-CoV-2 spike antigen (0.1 pm). The concentration of all interfering antigens is set to 10 pm. The baseline of the sensor is set at 0.1 pm concentration of SARS-CoV-2 S1 antigens. Individual interfering antigens are then added to this solution at a 1:1 ratio. A) Nyquist plots of the sensor with different interfering antigens, and B) their corresponding Rct values calculated by fitting the impedance graphs in (A). C) Nyquist plots of four identical sensors tested in the same buffer solution mixed with SARS-CoV-2 antigens (0.1 pm), and D) their corresponding Rct values. p-values were obtained as < 0.0001 when the sensors were compared with the baseline response. The PBS (50 mm) solution mixed with a ferro/ferricyanide (5 mm) mediator was used for the studies shown in this figure.

Similar articles

  • Prescription of Controlled Substances: Benefits and Risks.
    Preuss CV, Kalava A, King KC. Preuss CV, et al. 2025 Jul 6. In: StatPearls [Internet]. Treasure Island (FL): StatPearls Publishing; 2025 Jan–. 2025 Jul 6. In: StatPearls [Internet]. Treasure Island (FL): StatPearls Publishing; 2025 Jan–. PMID: 30726003 Free Books & Documents.
  • The effect of sample site and collection procedure on identification of SARS-CoV-2 infection.
    Davenport C, Arevalo-Rodriguez I, Mateos-Haro M, Berhane S, Dinnes J, Spijker R, Buitrago-Garcia D, Ciapponi A, Takwoingi Y, Deeks JJ, Emperador D, Leeflang MMG, Van den Bruel A; Cochrane COVID-19 Diagnostic Test Accuracy Group. Davenport C, et al. Cochrane Database Syst Rev. 2024 Dec 16;12(12):CD014780. doi: 10.1002/14651858.CD014780. Cochrane Database Syst Rev. 2024. PMID: 39679851 Free PMC article.
  • Workplace interventions to reduce the risk of SARS-CoV-2 infection outside of healthcare settings.
    Pizarro AB, Persad E, Durao S, Nussbaumer-Streit B, Engela-Volker JS, McElvenny D, Rhodes S, Stocking K, Fletcher T, Martin C, Noertjojo K, Sampson O, Verbeek JH, Jørgensen KJ, Bruschettini M. Pizarro AB, et al. Cochrane Database Syst Rev. 2022 May 6;5(5):CD015112. doi: 10.1002/14651858.CD015112.pub2. Cochrane Database Syst Rev. 2022. Update in: Cochrane Database Syst Rev. 2024 Apr 10;4:CD015112. doi: 10.1002/14651858.CD015112.pub3. PMID: 35514111 Free PMC article. Updated.
  • Antibody tests for identification of current and past infection with SARS-CoV-2.
    Fox T, Geppert J, Dinnes J, Scandrett K, Bigio J, Sulis G, Hettiarachchi D, Mathangasinghe Y, Weeratunga P, Wickramasinghe D, Bergman H, Buckley BS, Probyn K, Sguassero Y, Davenport C, Cunningham J, Dittrich S, Emperador D, Hooft L, Leeflang MM, McInnes MD, Spijker R, Struyf T, Van den Bruel A, Verbakel JY, Takwoingi Y, Taylor-Phillips S, Deeks JJ; Cochrane COVID-19 Diagnostic Test Accuracy Group. Fox T, et al. Cochrane Database Syst Rev. 2022 Nov 17;11(11):CD013652. doi: 10.1002/14651858.CD013652.pub2. Cochrane Database Syst Rev. 2022. PMID: 36394900 Free PMC article.
  • Electrophoresis.
    Sonagra AD, Zubair M, Dholariya SJ. Sonagra AD, et al. 2025 Jul 14. In: StatPearls [Internet]. Treasure Island (FL): StatPearls Publishing; 2025 Jan–. 2025 Jul 14. In: StatPearls [Internet]. Treasure Island (FL): StatPearls Publishing; 2025 Jan–. PMID: 36251838 Free Books & Documents.

References

    1. Nathanson N, in Viral Pathogenesis, 3rd Ed., (Eds: Katze MG, Korth MJ, Law GL, Nathanson N), Academic Press, Boston: 2016.
    1. a) Kalkeri R, Cai Z, Lin S, Farmer J, Kuzmichev YV, Koide F, Microorganisms 2021, 9, 1744; - PMC - PubMed
    2. b) Roy B, Dhillon J, Habib N, Pugazhandhi B, J. Biomed. Sci 2021, 8, 8.
    1. a) Ackerman CM, Myhrvold C, Thakku SG, Freije CA, Metsky HC, Yang DK, Ye SH, Boehm CK, Kosoko-Thoroddsen T-SF, Kehe J, Nature 2020, 582, 277; - PMC - PubMed
    2. b) Wang JS, Zhang DY, Nat. Chem 2015, 7, 545. - PMC - PubMed
    1. Muench P, Jochum S, Wenderoth V, Ofenloch-Haehnle B, Hombach M, Strobl M, Sadlowski H, Sachse C, Torriani G, Eckerle I, J. Clin. Microbiol 2020, 58, 01694. - PMC - PubMed
    1. Meyer B, Torriani G, Yerly S, Mazza L, Calame A, Arm-Vernez I, Zimmer G, Agoritsas T, Stirnemann J, Spechbach H, Clin. Microbiol. Infect 2020, 26, 1386. - PMC - PubMed

LinkOut - more resources