. 2025 Jul 30:16:1570992.
doi: 10.3389/fimmu.2025.1570992. eCollection 2025.

Experimental validation of cuproptosis-associated molecular signatures and their immunological implications in pulmonary tuberculosis

Affiliations

Experimental validation of cuproptosis-associated molecular signatures and their immunological implications in pulmonary tuberculosis

Xiaofang Liu et al. Front Immunol. .

Abstract

Background: The pathogenic mechanism underlying Mycobacterium tuberculosis (MTB) remains elusive, posing challenges to its diagnosis and treatment. Cuproptosis is a newly identified mechanism of cell death. This study explores the role of cuproptosis-related genes (CRGs) in pulmonary tuberculosis (PTB) to uncover potential diagnostic biomarkers and therapeutic targets.

Methods: Differentially expressed gene (DEG) analysis and weighted gene co-expression network analysis (WGCNA) were carried out using the GSE83456 dataset. PTB-associated DEGs were intersected with CRGs to identify PTB-related CRGs. Subsequent analyses included functional enrichment, gene interaction, and protein-protein interaction (PPI) network construction. Hub CRGs were screened out via least absolute shrinkage and selection operator (LASSO) regression and random forest (RF) algorithms. Diagnostic models were subsequently constructed and validated. The associations of immune cell infiltration and pathway with the identified hub genes were evaluated through single-sample gene set enrichment analysis (ssGSEA) and CIBERSORT. Hub gene expressions were validated in the GSE42834 and GSE89403 datasets, as well as by RT-qPCR and Western blot (WB) in PTB and extrapulmonary tuberculosis (EPTB) patients. The GSE89403 dataset and gene expression profiling were leveraged to analyze the differential expression of hub genes and their dynamic changes during treatment.

Results: Seven PTB-related CRGs were significantly upregulated, were significantly upregulated, among which ASPHD2, GK, and GCH1 were identified as hub genes. These genes exhibited high expression levels in patients with PTB and EPTB, with marked reductions observed following treatment. Notable alterations in immune cell infiltration and immune function in PTB patients were closely related to these hub genes, suggesting activation of innate immune responses and suppression of adaptive immune function.

Conclusion: The cuproptosis hub genes ASPHD2, GK, and GCH1 influence the pathogenesis of PTB, and possibly serve as novel diagnostic biomarkers and therapeutic targets.

Keywords: cuproptosis; experimental validation; gene expression analysis; immune dysregulation; pulmonary tuberculosis.


Conflict of interest statement

The authors declare that the research was conducted in the absence of any commercial or financial relationships that could be construed as a potential conflict of interest.

Figures
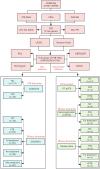
Figure 1
Figure 1
Flowchart of identification and experimental validation of key CRGs in TB. NC (normal control), PTB (pulmonary tuberculosis), LTBI(latent tuberculosis infection), EPTB (extrapulmonary tuberculosis), DEGs (differentially expressed genes), WGCNA (weighted gene co-expression network analysis), CRGs (cuproptosis-related genes), DO (disease ontology), GO (gene ontology), KEGG (Kyoto encyclopedia of genes and genomes), GGI (gene-gene interaction), PPI (protein-protein interaction), LASSO (least absolute shrinkage and selection operator), ROC (receiver operating characteristic curve), CIBERSORT (cell-type identification by estimating relative subsets of RNA transcripts), ssGSEA (single-sample gene set enrichment analysis), GEO (gene expression omnibus), PCR (polymerase chain reaction), 1m treatment (1-month treatment), 7d treatment (7-day treatment), 4w treatment (4-week treatment), and 24w treatment (24-week treatment).
Figure 2
Figure 2
DEGs and functional enrichment analysis between PTB and normal samples in the GSE83456 dataset. (A) A microarray heatmap and hierarchical clustering of DEGs. Upregulated genes are displayed in red, while downregulated genes are shown in blue. (B) A volcano plot illustrating the DEGs between PTB and normal samples. The red dots represent upregulated DEGs, the green dots represent downregulated DEGs, and the black dots denote genes with no significant changes. (C) GSEA results show significant enrichment of upregulated genes in immune-related pathways, including Staphylococcus aureus infection (NES = 0.83, FDR < 0.001), Leishmaniasis (NES = 0.74, FDR < 0.001), Complement and coagulation cascades (NES = 0.74, FDR < 0.001), Systemic lupus erythematosus (NES = 0.74, FDR < 0.001), Pertussis (NES = 0.73, FDR < 0.001). (D) GSEA results show significant enrichment of downregulated genes in pathways related to ribosome and metabolism, including Ribosome (NES = -0.66, FDR < 0.001), Ribosome biogenesis in eukaryotes (NES = -0.57, FDR < 0.001), Alanine, aspartate and glutamate metabolism (NES = -0.56, FDR = 0.041), DNA replication (NES = -0.55, FDR = 0.047), Nucleotide excision repair (NES = -0.49, FDR = 0.039). *p < 0.05, **p < 0.01, ***p < 0.001.
Figure 3
Figure 3
Co-expression network construction and correlation analysis with PTB phenotypes. Coexpression network and correlation analysis with PTB phenotypes. (A, B) Scale-free network construction with scale independence and mean connectivity analysis (b = 6). (C) Sample clustering tree, with merging of modules with similar expression profiles. (D) Module identification: Network dendrogram based on differential measurements and module colors. Each node represents a gene; the vertical axis shows topological differences between genes, and the horizontal axis represents different modules. Each color indicates a module, and the bar width indicates the number of genes in the module. Dynamic Tree Cut was used for the initial clustering, with similar modules merged for the final reconstruction. (E) Module-trait correlation: Heatmap showing correlations between modules and TB traits. Cell color indicates correlation strength (deeper red for positive, deeper blue for negative), with the value in each cell indicating the correlation coefficient and the value in brackets showing the p-value. (F) The scatter plot shows a correlation of 0.92 (p < 0.001) between gene significance and module membership in the yellow module, highlighting its strongest association with the PTB phenotype.
Figure 4
Figure 4
Screening, functional enrichment, and interaction network analysis of PTB CRGs. (A) Venn diagram of 137 DEGs significantly associated with PTB identified by WGCNA and 190 DEGs in PTB, yielding 31 PTB intersecting genes. (B) Venn diagram of the 31 PTB intersecting genes and 2,977 CRGs, yielding 7 upregulated PTB CRGs: OASL, OAS2, ASPHD2, GK, TCN2, OAS3, and GCH1. (C) DO analysis results for PTB CRGs. (D) GO analysis of PTB CRGs in BP, CC, and MF. (E) KEGG pathway analysis results for PTB CRGs. (F) GGI network analysis of PTB CRGs based on the GeneMANIA database, showing the connectivity and functional associations of the identified genes. (G) PPI network analysis of PTB CRGs, depicting direct protein interactions and their roles in shared biological pathways.
Figure 5
Figure 5
Application analysis of LASSO regression and RF models in the feature selection and prediction of PTB (A)Variation of each feature coefficient with the regularization parameter λ in LASSO regression. As λ increases, the feature coefficients gradually decrease and approach zero, indicating that LASSO regression effectively performs feature selection by enhancing the regularization, ultimately resulting in a simplified model. (B) Variation of the binomial deviance with the regularization parameter λ in the LASSO regression. Initially, as λ increases, the deviance decreases but subsequently rises, indicating that the optimal λ corresponds to the minimum deviance, balancing model complexity and fitting accuracy. (C) Change in the error rate of the RF model with different numbers of trees. As the number of trees rises from 0 to 500, the error rate gradually declines. The error rate tends to stabilize around 300 trees, and a further increase in the number of trees does not significantly improve the error rate. Therefore, 300 trees were selected to optimize performance and save computational resources. (D) Gene importance scores in the RF model. The GCH1 gene received the highest score, indicating its significant contribution to the model’s prediction. Other important genes include OAS2, GK, etc. These scores help to identify hub genes in the predictive model and provide guidance for subsequent biological research.
Figure 6
Figure 6
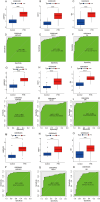
Expression analysis and diagnostic performance of hub genes ASPHD2, GCH1, and GK in PTB patients. (A–C) Expression levels of ASPHD2, GCH1, and GK were significantly upregulated in PTB patients in the training set GSE83456 (p < 0.001). (D–F) ROC curve analysis based on GSE83456 demonstrated excellent diagnostic performance for all three genes: ASPHD2 (AUC = 0.981, 95% CI: 0.981-1.000), GCH1 (AUC = 0.928, 95% CI: 0.928-0.982), and GK (AUC = 0.937, 95% CI: 0.937-0.979). (G–I) In the validation set GSE42834, all three genes also showed significantly elevated expression in PTB patients (p < 0.001). (J–L) ROC analysis in GSE42834 yielded the following results: ASPHD2 (AUC = 0.962, 95% CI: 0.924-1.000), GCH1 (AUC = 0.879, 95% CI: 0.792-0.966), and GK (AUC = 0.962, 95% CI: 0.926-0.998). (M–O) In the validation set GSE89403, the expression levels of all three genes remained significantly elevated in PTB patients (p < 0.001). (P–R) ROC analysis of GSE89403 confirmed robust diagnostic performance: ASPHD2 (AUC = 0.916, 95% CI: 0.843-0.990), GCH1 (AUC = 0.805, 95% CI: 0.716-0.895), and GK (AUC = 0.816, 95% CI: 0.721-0.912). An AUC > 0.9 indicates excellent diagnostic accuracy; 0.8-0.9 indicates good accuracy; 0.7-0.8 is considered acceptable; and an AUC < 0.7 reflects poor diagnostic performance. ***p < 0.001.
Figure 7
Figure 7
Construction and clinical evaluation of the PTB risk prediction model. (A) Nomogram for predicting PTB risk based on the expression levels of ASPHD2, GK, and GCH1 genes. (B) Calibration curve comparing the predicted probability with the actual probability. The predicted probability is close to the ideal line (diagonal line), indicating the excellent calibration performance of the model. (C) Decision curve analysis shows that the model provides a high and stable net benefit within a threshold probability range of 0 to 0.6, demonstrating its significant clinical application value in predicting PTB risk.
Figure 8
Figure 8
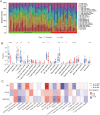
CIBERSORT analysis of PTB patients and its correlation with cuproptosis-related hub genes in PTB patients. (A) Analysis of immune cell infiltration in PTB patients and the NC group. CIBERSORT analysis revealed significant differences in the relative abundance of 22 immune infiltrating cell types between the two groups. (B) Scatter plot showing the differences in immune cell infiltration between the PTB group and the NC group. (C) Correlation analysis between cuproptosis hub genes and infiltrating immune cells. *p < 0.05, **p < 0.01, ***p < 0.001.
Figure 9
Figure 9
Differences in immune functions and cell types between PTB patients and normal controls, and correlation analysis with hub genes and immune features. (A, B) Analysis results from the training set GSE83456.(A) Significant differences in various immune functions and cell infiltration between the PTB and NC groups. (B) Correlation analysis between hub genes and immune features. (C, D) Analysis results from the validation set GSE42834.(C) Significant differences in various immune functions and cell infiltration between the PTB and NC groups. (D) Correlation analysis between hub genes and immune features. (E, F) Analysis results from the validation set GSE89403.(E) Significant differences in various immune functions and cell infiltration between the PTB and NC groups. (F) Correlation analysis between hub genes and immune features.*Note: The X-axis represents ssGSEA scores (0-1) or hub genes, and the Y-axis represents immune features. Green represents NC and red represents PTB. *p < 0.05, **p < 0.01, ***p < 0.001. #p ≥ 0.05; p < 0.2, near-significant results. ns, not significant.
Figure 10
Figure 10
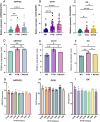
Validation and expression analysis of cuproptosis-related hub genes in PTB. (A–C) The relative expression levels of ASPHD2, GCH1, and GK genes in normal individuals, PTB patients, and EPTB patients were analyzed by RT-qPCR. (D–F) Relative expression levels of ASPHD2, GCH1, and GK genes in NC, PTB patients before treatment, and PTB patients after 1 month of anti-TB treatment, based on gene chip expression profiles. (G–I) Expression levels of ASPHD2, GCH1, and GK genes in different subtypes of EPTB. Patients were categorized based on the main affected sites: genitourinary TB (GUTB, n = 9), tuberculous meningitis (TBM, n = 6), lymph node TB (LNTB, n = 6), osteoarticular TB (OATB, n = 4), tuberculous spinal meningitis (TSM, n = 3), gastrointestinal TB (GITB, n = 3), and abdominal TB (ATB, n = 3). No statistically significant differences in gene expression were observed among these EPTB subtypes. X-axis: group classification. Y-axis: relative gene expression levels. *p < 0.05, **p < 0.01, ****p < 0.0001, ns, not significant.
Figure 11
Figure 11
Dynamic analysis of the expression of PTB cuproptosis-related hub genes in PTB patients during treatment in the GSE89403 dataset. X-axis: Grouping information, including normal control, pulmonary tuberculosis (PTB), after 7 days of treatment (7d treatment), after 4 weeks of treatment (4w treatment), and after 24 weeks of treatment (24w treatment). Y axis: Relative expression level. *p < 0.05, ***p < 0.001, ns stands for not significant.
Figure 12
Figure 12
WB analysis of ASPHD2, GCH1, and GK protein expression in PBMCs across five clinical groups. (A, C, E) Representative WB bands for ASPHD2, GCH1, and GK in healthy controls (HC), latent TB infection (LTBI), active pulmonary TB (PTB), PTB after one month of anti-TB treatment (AT), and extrapulmonary TB (EPTB), with molecular weights (kDa) indicated. (B, D, F) Quantification of relative protein expression levels. Data are presented as mean ± SD with individual data points overlaid. Effect sizes were assessed using Cohen’s *d* to compare group differences.

Similar articles

References

    1. WHO . Global tuberculosis report 2024. Geneva: World Health Organization; (2024).
    1. Nisa A, Kipper FC, Panigrahy D, Tiwari S, Kupz A, Subbian S. Different modalities of host cell death and their impact on Mycobacterium tuberculosis infection. Am J Physiol Cell Physiol. (2022) 323:C1444–c74. doi: 10.1152/ajpcell.00246.2022, PMID: - DOI - PMC - PubMed
    1. Tsvetkov P, Coy S, Petrova B, Dreishpoon M, Verma A, Abdusamad M, et al. Copper induces cell death by targeting lipoylated TCA cycle proteins. Sci (New York NY). (2022) 375:1254–61. doi: 10.1126/science.abf0529, PMID: - DOI - PMC - PubMed
    1. Chen J, Jiang Y, Shi H, Peng Y, Fan X, Li C. The molecular mechanisms of copper metabolism and its roles in human diseases. Pflugers Archiv. (2020) 472:1415–29. doi: 10.1007/s00424-020-02412-2, PMID: - DOI - PubMed
    1. Wang J, Lv C, Wei X, Li F. Molecular mechanisms and therapeutic strategies for ferroptosis and cuproptosis in ischemic stroke. Brain Behav Immun Health. (2024) 40:100837. doi: 10.1016/j.bbih.2024.100837, PMID: - DOI - PMC - PubMed

LinkOut - more resources