. 2025 Jul 30:16:1614055.
doi: 10.3389/fmicb.2025.1614055. eCollection 2025.

Metagenomic insights into surface sediment microbial community and functional composition along a water-depth gradient in a subtropic deep lake

Affiliations

Metagenomic insights into surface sediment microbial community and functional composition along a water-depth gradient in a subtropic deep lake

Peixuan Zhang et al. Front Microbiol. .

Abstract

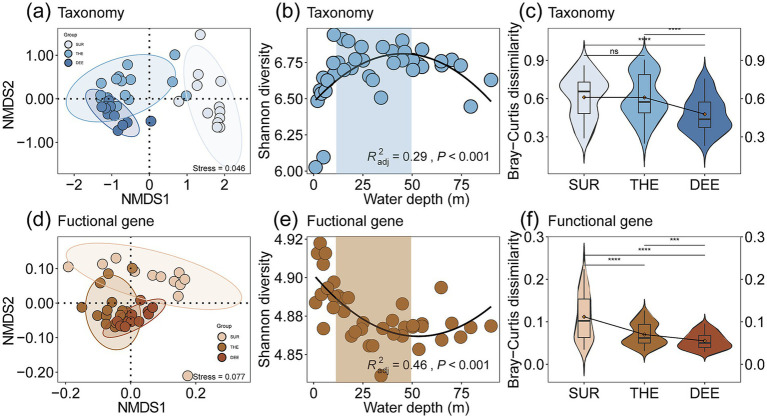
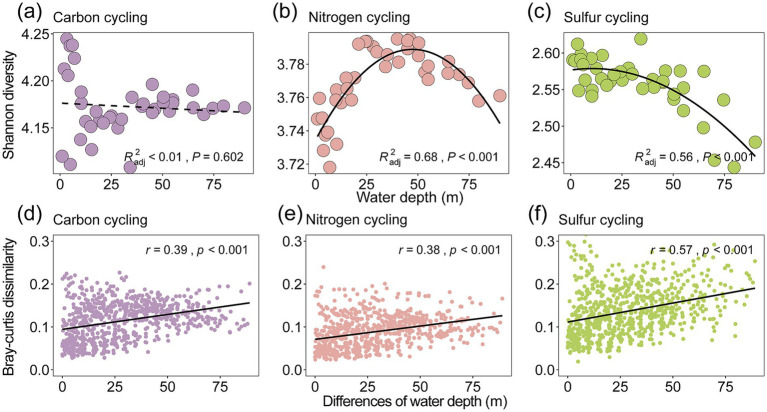
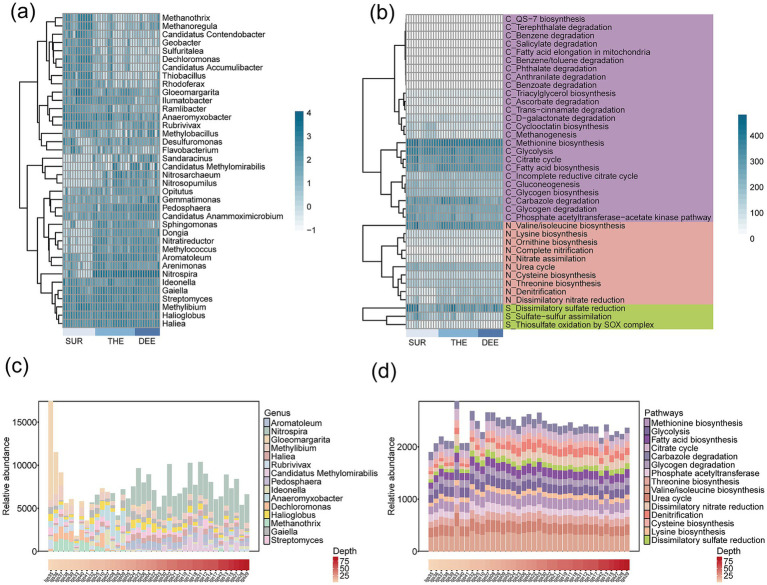
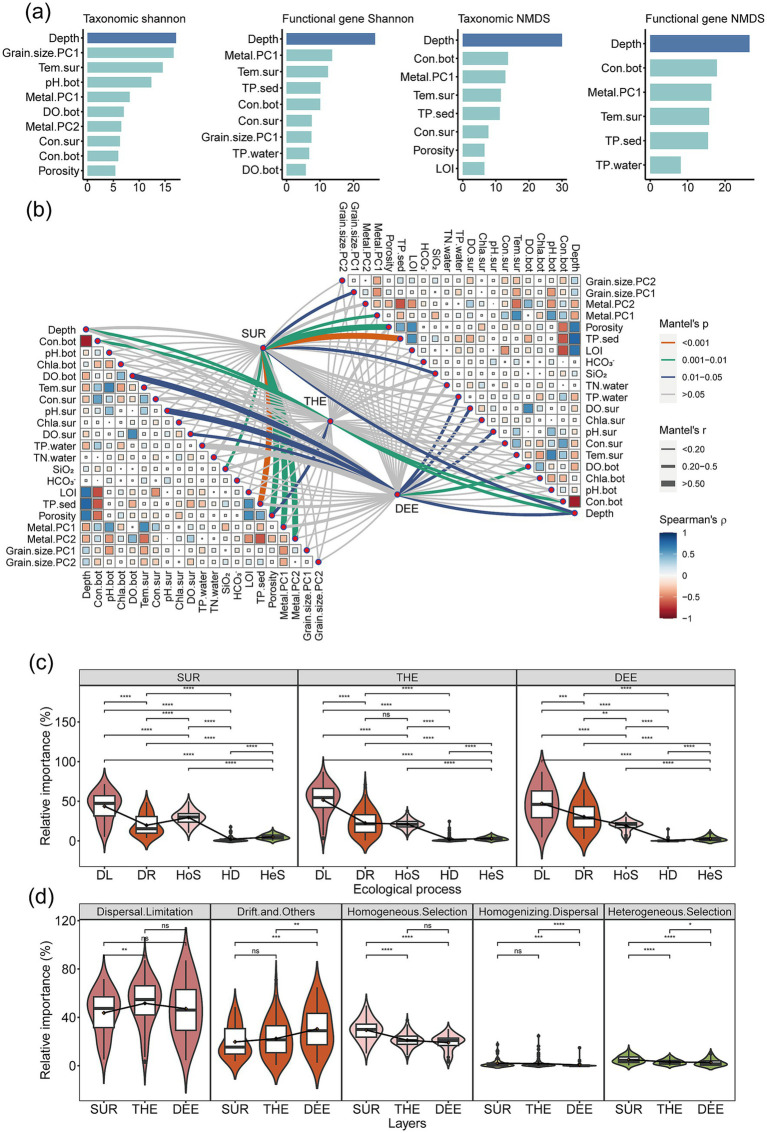
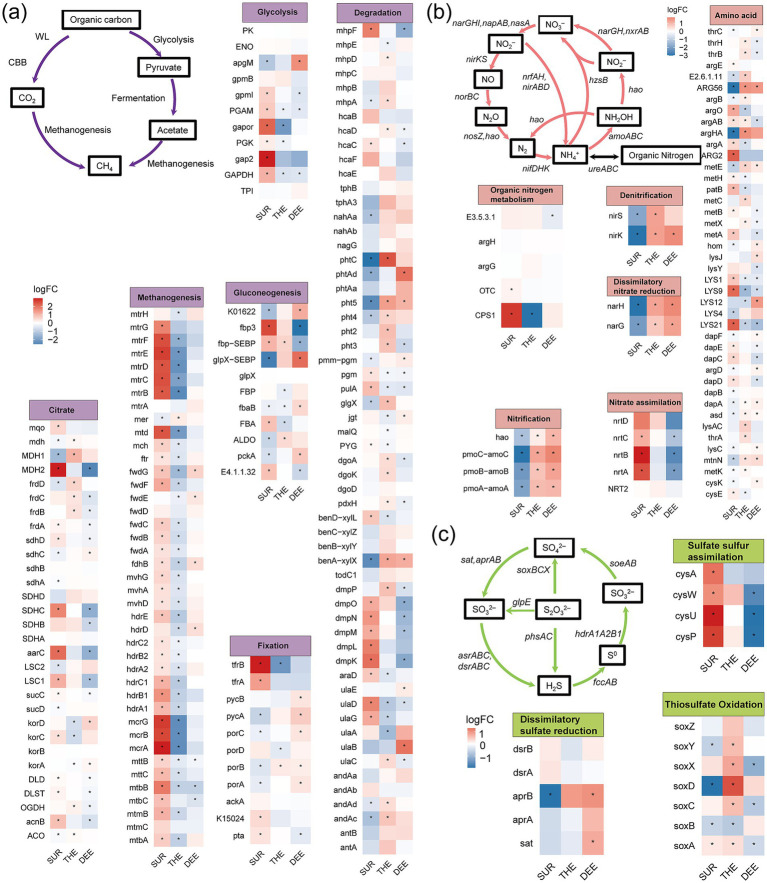
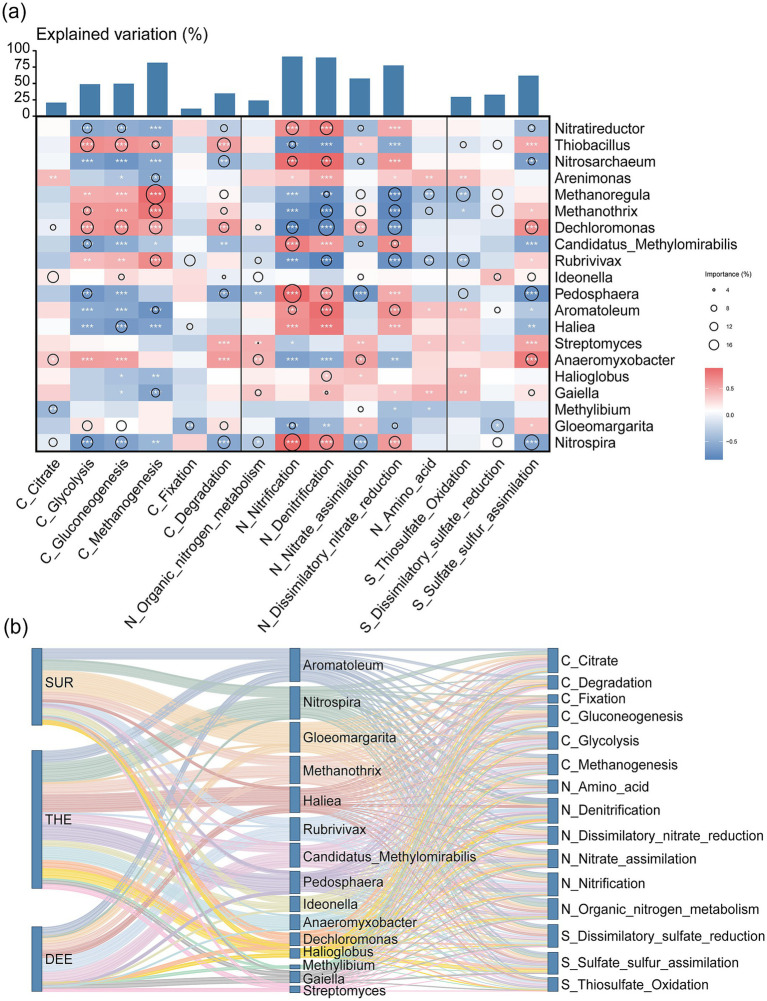
Deep lakes play a critical role in global elemental cycling and serve as habitats for diverse microbial communities. However, studies on the effects of lake stratification on microbial composition and functional potential in surface sediments remain limited. Here, we investigated microbial community structure and functional composition using metagenomics of 38 surface sediments across a depth gradient of 0-90 m in Lugu Lake, China. Our results showed that Shannon diversity peaked at the thermocline for microbial communities, while a U-shaped pattern for functional genes. Microbial communities and functional genes in the surface sediments showed higher spatial heterogeneity at the shallow layer, whereas those at deeper layers tended toward more homogenized. Although water depth was the most important driver in explaining 29.9 and 26.5% of variance in microbial and functional gene composition, stochastic processes primarily governed the community assemblages, particularly dispersal limitation with the contribution of 43.7%. We further found the surface layer was enriched in genes mainly involved in aerobic metabolism and methanogenesis. In contrast, genes related to reduction reactions, including dissimilatory nitrate and sulfate reduction were more abundant in the thermocline and deep layer, reflecting lower redox potential in a deeper layer. Overall, our results provide evidence for microbial community stratification and functional partitioning in deep lakes.

Keywords: deep lake; functional gene; metagenomic; microbial community; water depth.


Conflict of interest statement

The authors declare that the research was conducted in the absence of any commercial or financial relationships that could be construed as a potential conflict of interest. The reviewer DH declared a shared parent affiliation with the authors MR and JW to the handling editor at the time of review.

Figures

Figure 1
Figure 1
Comparisons of microbial and functional diversity and composition among different water layers. Non-Metric Multidimensional Scaling (NMDS) plots of (a) taxonomy and (d) functional genes. Each point represents a sample, which was colored by water depth, from surface layer (SUR, 0–10 m) to thermocline (THE, 10–50 m) and then to deep layer (DEE, 50–90 m). The Shannon diversity of (b) taxonomy and (e) functional genes among three water layers. Differences in microbial beta diversity consisting of (c) taxonomic and (f) functional genes variation (determined by pair Bray–Curtis distance) among three water layers. Different asterisks in the violin plots denote significant differences in corresponding variables between layer (determined by a two-sided pairwise Wilcoxon test). *p < 0.05, **p < 0.01, and ***p < 0.001, and ns: non-significant. In boxplots, the lower and upper hinges of the box correspond to the first and third quartiles (the 25th and 75th percentiles); the upper and lower whiskers extend from the hinge to the largest and smallest values no further than 1.5 times the interquartile range (IQR), respectively; and the central lines represent the median.
Figure 2
Figure 2
Water-depth diversity patterns and distance-decay relationship for functional genes. We considered the Shannon diversity of the three subgroups of functional genes involved in carbon cycling (a), nitrogen cycling (b), and sulfur cycling (c) (Supplementary Table S3). The relationships between functional gene diversity and water depth were evaluated by linear and quadratic models. The better model was selected based on the lower value of the Akaike information criterion. The lower panels (d–f) show the relationships between water depth changes and Bray–Curtis dissimilarity of the three subgroups. Linear regressions of relationships based on a linear model are shown with a solid line. Mantel tests were used to examine correlations between differences in functional gene composition and differences in community composition using 9,999 permutations. The Mantel r-values are shown, with all p-values being less than 0.001. The term “water depth” in this study specifically refers to depth of surface sediments.
Figure 3
Figure 3
The composition of taxonomic groups and functional traits across different water depths. (a) Microbial community and (b) functional gene profiles, with samples ordered by water depth. SUR, surface layer; THE, thermocline; DEE, deep layer. Darker colors correspond to higher relative abundances. The relative abundance of (c) microbial genus and (d) functional pathways in samples from different water depths. Only the top 15 microbial genera with high relative abundances are annotated in the figure.
Figure 4
Figure 4
Environmental factors and ecological processes shaping microbial community structure and functional genes. (a) Relative contribution of environmental factors to taxonomic and functional diversity. Random forest analysis identified and quantified significant predictors of Shannon diversity and composition. The first axis of NMDS was used to represent composition. We selected the explanatory variables with a relative contribution rate >5%. Details of variable abbreviations are provided in Supplementary Table S1. (b) Associations between microbial community structure and functional gene composition (determined by Bray–Curtis distance) with environmental factors (determined by Euclidean distance) using the partial Mantel test. Partial Mantel’s r values are indicated by the edge width, while the statistical significance is denoted by the edge color. Pairwise correlations of environmental variables are depicted with a color gradient reflecting Spearman’s correlation coefficient. (c) The relative contribution of each ecological process driving microbial community assembly within the layer based on null model analysis (n = 231). (d) Differences in the relative importance of ecological processes among three water layers (n = 231). Different lowercase letters in box plots indicate significant differences for the ecological processes with soil depth (determined by a two-sided Wilcoxon test, p < 0.05). SUR, surface layer; THE, thermocline layer; DEE, deep layer. Central line and whiskers in each box represent the median and 1.5 times the interquartile range, respectively. Boxes indicate the interquartile range between 25th and 75th percentiles. Single points are outliers.
Figure 5
Figure 5
Differences in the abundance of functional genes involved in C, N, and S cycling across three layers. The heatmap shows the enrichment of functional genes involved in (a) carbon cycling, (b) nitrogen cycling, and (c) sulfur cycling among three water layers. Statistical significance of the changes in gene abundance was assessed by a generalized linear model with a negative binomial distribution using edgeR package. The p-values were obtained from two-sided likelihood ratio tests (LRTs) and adjusted for multiple comparisons via the Benjamini–Hochberg procedure. Genes with significant changes in abundance (p < 0.05) are indicated with an asterisk. LogFC, log2-fold change. The full names of the genes in this figure are listed in Supplementary Table S3. SUR, surface layer; THE, thermocline layer; DEE, deep layer.
Figure 6
Figure 6
Contribution of microbial communities to biogeochemical processes across different water layers. (a) The contribution of microbial genus to each metabolic pathway through random forest analysis is represented by circles of different sizes. The color gradient reflects the strength of the Spearman correlation coefficient, where dark blue indicates a strong positive correlation, and dark red represents a strong negative correlation. Statistical significance is denoted by asterisks: ***p < 0.001, **p < 0.01, and *p < 0.05. (b) The Sankey diagram illustrates the difference in the contributions of microbial groups to specific biogeochemical processes across three water layers, with the taxonomic classification of microbial groups and their associated category of functional pathways. The three columns represent, from left to right, water layers, taxonomic groups, and metabolic pathways, respectively. SUR, surface layer; THE, thermocline layer; DEE, deep layer.

Similar articles

References

    1. Aljohani A., Clarke D., Byrne M., Fleming G. (2024). The bacterial microbiome and resistome of house dust mites in Irish homes. Sci. Rep. 14:19621. doi: 10.1038/s41598-024-70686-y, PMID: - DOI - PMC - PubMed
    1. Anantharaman K., Brown C. T., Hug L. A., Sharon I., Castelle C. J., Probst A. J., et al. (2016). Thousands of microbial genomes shed light on interconnected biogeochemical processes in an aquifer system. Nat. Commun. 7:13219. doi: 10.1038/ncomms13219 - DOI - PMC - PubMed
    1. Andrews S., Krueger F., Segonds-Pichon A., Biggins L., Krueger C., Wingett S. (2010). FastQC. A quality control tool for high throughput sequence data. 370, Available online at: http://www.bioinformatics.babraham.ac.uk/projects/fastqc. (Accessed July 22, 2025).
    1. Ayala-Muñoz D., Macalady J. L., Sánchez-España J., Falagán C., Couradeau E., Burgos W. D. (2022). Microbial carbon, sulfur, iron, and nitrogen cycling linked to the potential remediation of a meromictic acidic pit lake. ISME J. 16, 2666–2679. doi: 10.1038/s41396-022-01320-w, PMID: - DOI - PMC - PubMed
    1. Bacchetta T., López-García P., Gutiérrez-Preciado A., Mehta N., Skouri-Panet F., Benzerara K., et al. (2022). Description of Gloeomargarita ahousahtiae sp. nov., a thermophilic member of the order Gloeomargaritales with intracellular carbonate inclusions. Eur. J. Phycol. 59, 11–20. doi: 10.1080/09670262.2023.2216257 - DOI

LinkOut - more resources