

Editorial
doi: 10.3389/fsysb.2024.1432791.
eCollection 2024.
Specialty grand challenge: how can we use integrative approaches to understand microbial community dynamics?
Affiliations
- PMID: 40809114
- PMCID: PMC12342006
- DOI: 10.3389/fsysb.2024.1432791
Item in Clipboard
Editorial
Specialty grand challenge: how can we use integrative approaches to understand microbial community dynamics?
Front Syst Biol.
.
No abstract available
Keywords: ecology; integrative “omics”; microbiology; multivariate statistical analyses; regression analysis.
Conflict of interest statement
The authors declare that the research was conducted in the absence of any commercial or financial relationships that could be construed as a potential conflict of interest. The author(s) declared that they were an editorial board member of Frontiers, at the time of submission. This had no impact on the peer review process and the final decision.
Figures

The CODA-LASSO approach extends the linear regression approach by taking log abundances of microbiome data and considering two additional constraints. Constraint 1 is the LASSO constraint that forces some of the beta coefficients to go to zero allowing for variable selection, while constraint 2 ensures that there are two subsets of beta coefficients of microbes, those that are positively associated with the outcome, and those that are negatively associated with the outcome.

GLLVM procedure that fits a distribution for each microbe and regresses against all covariates to obtain beta coefficients that reveal positive or negative relationships.

Mediation analysis where the path from Treatment to Outcome is established after solving the inverse regression problem and testing the corresponding beta coefficients that exist on that path.

BIOENV approach, where the similarity distance is calculated for a fixed matrix (microbiome) and the features in the variable table are permuted to calculate a variable similarity distance in such a way that those subsets are retained where the correlation between the distances of the two matrices is optimized.

Constrained ordinations, where the left side visualization is obtained for CCA/RDA with the length of the arrows pointing to the direction of increase of the continuous covariates, while the right side is the smooth contour of a continuous covariate on the reduced ordination space. It should be noted that for CCA/RDA categorical variables can also be used where we get separate vectors for each factor of a categorical variable.

The Ensemble Quotient optimization algorithm works by finding an ensemble (a subset of microbes) that either remains stable (Uniform), has a stratified response (Categorical), or correlates with a covariate of interest (Continuous).

(A) Given
, the proportional abundance of a microbe in the
-th environment,
an environmental property (continuous covariate) is associated with each environment. (B) In the total number of environments being
(stratification based on some commonality among samples), we can assume for
, and
to be fairly stable within the environment and vary more across the environments. (C) Hurlbert’s
and Feinsinger’s PS statistic indicates a negative or positive relationship between a microbe and an environmental property. A null modeling procedure is considered by generating a random normal distribution with 999 possible estimates, and by labeling a microbe as “negative” if the metric <fifth Quantile, and “positive”, if the metric >95th Quantile. (D) For Proportional Overlap
, X (for microbe i) and Y (for microbe j) are Feinsinger’s PS.
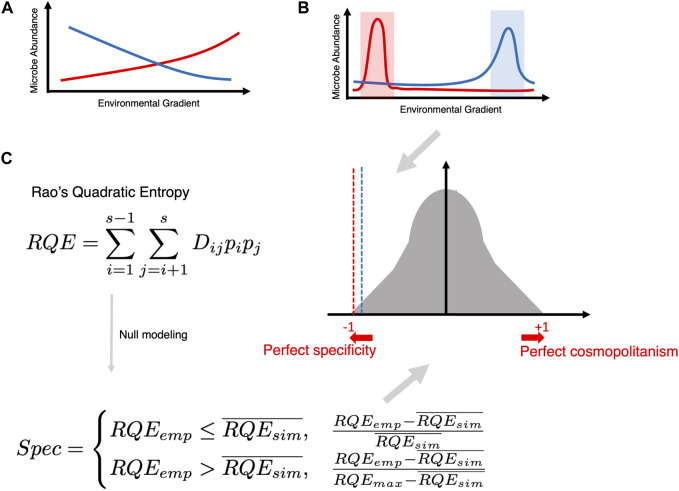
(A) Traditional way of finding an association (whether negative or positive) between microbial abundance and a continuous covariate of interest. (B) The goal of specificity analysis is to find microbes that become specific within a narrow range of a covariate of interest. (C) Creating a null distribution utilizing Rao’s Quadratic Entropy formula (which incorporates the difference of the covariate across two samples
and
as
, multiplied by the relative abundance of the microbe across two samples as
and
). These are calculated for all pairwise combinations of samples (
). The empirical value is then compared with the average of the 999 null distribution values to tag a microbe as specific (Spec ∼ −1) or cosmopolitan (Spec ∼ +1).

The core microbiome is established by first ranking the microbes based on a combination of two criteria, Site-specific Occupancy and Replicate Consistency, and then using the Bray-Curtis (BC) contribution of the core subset to the whole community; the core subset is iteratively constructed until the stopping criteria are reached. The core subset is then further discretized to those that: fall above the neutral model (selected by host/environment and represented by red dots in the bottom right figure); fall below the neutral model (selected by dispersal limitation and represented by blue dots); and those that fit the 95% CI of the neutral model (represented by green dots).

Illustration of the sPLSDA algorithm and its extension. The optimization algorithms are shown for all cases along with the weighting strategy for DIABLO shown in a table.
Similar articles
-
Whole-Person Healing to the People: Culturally Affirming and Community-Based Approaches to Integrative Health Equity.Glob Adv Integr Med Health. 2025 Jul 4;14:27536130251357522. doi: 10.1177/27536130251357522. eCollection 2025 Jan-Dec. Glob Adv Integr Med Health. 2025. PMID: 40620320 Free PMC article.
-
The health economics of insulin therapy: How do we address the rising demands, costs, inequalities and barriers to achieving optimal outcomes.Diabetes Obes Metab. 2025 Jul;27 Suppl 5(Suppl 5):24-35. doi: 10.1111/dom.16488. Epub 2025 Jun 4. Diabetes Obes Metab. 2025. PMID: 40464081 Free PMC article.
-
Integrative systems biology approaches for analyzing microbiome dysbiosis and species interactions.Brief Bioinform. 2025 Jul 2;26(4):bbaf323. doi: 10.1093/bib/bbaf323. Brief Bioinform. 2025. PMID: 40619813 Free PMC article. Review.
-
Microbiomes in animal ecology: Advances, assumptions, and opportunities.Integr Comp Biol. 2025 Jun 28:icaf112. doi: 10.1093/icb/icaf112. Online ahead of print. Integr Comp Biol. 2025. PMID: 40580119
-
Designing causal mediation analyses to quantify intermediary processes in ecology.Biol Rev Camb Philos Soc. 2025 Aug;100(4):1512-1533. doi: 10.1111/brv.70011. Epub 2025 Mar 9. Biol Rev Camb Philos Soc. 2025. PMID: 40059404 Review.
References
-
- Anderson M. J., Legendre P. (1999). An empirical comparison of permutation methods for tests of partial regression coefficients in a linear model. J. Stat. Comput. Simul. 62 (3), 271–303. 10.1080/00949659908811936 - DOI
-
- Andries E., Nikzad-Langerodi R. (2022). Dual-constrained and primal-constrained principal component analysis. J. Chemom. 36 (5), e3403. 10.1002/CEM.3403 - DOI
Publication types
LinkOut - more resources
Full Text Sources