

Data-driven cluster analysis on the association of aging, obesity and insulin resistance with new-onset diabetes in Chinese adults: a multicenter retrospective cohort study
- PMID: 40809436
- PMCID: PMC12343622
- DOI: 10.3389/fmed.2025.1640017
Data-driven cluster analysis on the association of aging, obesity and insulin resistance with new-onset diabetes in Chinese adults: a multicenter retrospective cohort study
Abstract
Background: Type 2 diabetes mellitus (T2DM) is an endocrine and metabolic disorder that can lead to multi-organ damage and dysfunction, imposing significant financial burden on national healthcare systems. Currently, the early identification of high-risk individuals and the prevention of T2DM remain major challenges for clinicians. This study aimed to use easily obtainable clinical indicators to perform cluster analysis on healthy individuals, in order to accurately identify high-risk population requiring early intervention.
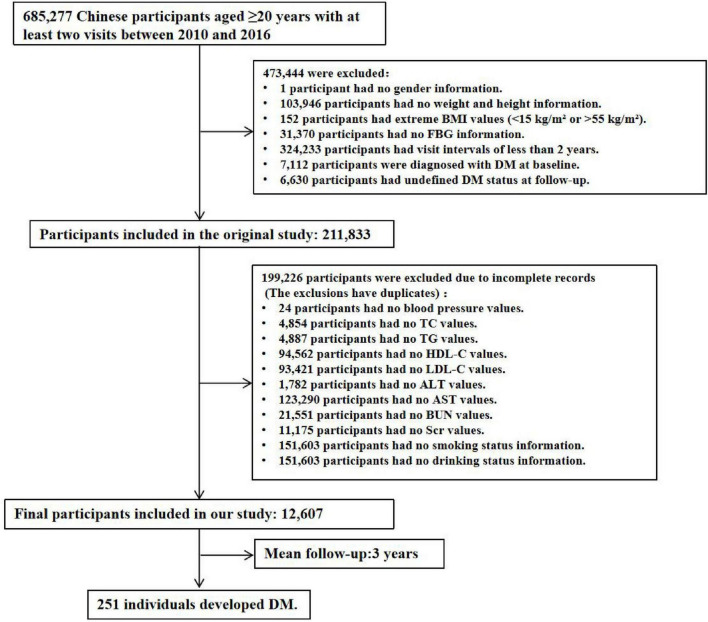
Methods: This study was a multicenter retrospective cohort study with a median follow-up period of 3 years. A total of 12,607 Chinese adult individuals without diabetes at baseline were included. The K-means clustering algorithm was applied to five standardized indicators: age, body mass index (BMI), fasting blood glucose (FBG), triglycerides (TG), and HDL-C (high-density lipoprotein cholesterol). After clustering, multivariate Cox proportional hazards regression analysis was used to evaluate and compare the risk of diabetes incidence among different clusters.
Results: The study population comprising 12,607 subjects was clustered into four distinct groups: Cluster 1 (metabolic health cluster), Cluster 2 (low HDL-C cluster), Cluster 3 (old age and mild metabolic disorder cluster), and Cluster 4 (severe obesity and insulin resistance cluster). The proportional distributions of each cluster were 37.95, 29.99, 24.95, and 7.11%, respectively. The clinical characteristics and diabetes incidence risks varied significantly among the four clusters. Cluster 4 exhibited the highest diabetes incidence rate, followed by Cluster 3, Cluster 2, and Cluster 1. In all models adjusted for covariates, the diabetes incidence rates in Cluster 3 and Cluster 4 were significantly higher than those in Cluster 1 and Cluster 2. However, no significant difference was observed between Cluster 3 and Cluster 4.
Conclusion: Cluster-based analyses can effectively identify individuals at high risk of diabetes in the normal population. These high-risk groups (clusters 3 and 4) are often associated with aging, obesity, and insulin resistance (IR), necessitating early and targeted interventions.
Keywords: aging; cluster analysis; insulin resistance; obesity; type 2 diabetes mellitus.
Copyright © 2025 Wang, Zhang and Wang.
Conflict of interest statement
The authors declare that the research was conducted in the absence of any commercial or financial relationships that could be construed as a potential conflict of interest.
Figures


Similar articles
-
Prescription of Controlled Substances: Benefits and Risks.2025 Jul 6. In: StatPearls [Internet]. Treasure Island (FL): StatPearls Publishing; 2025 Jan–. 2025 Jul 6. In: StatPearls [Internet]. Treasure Island (FL): StatPearls Publishing; 2025 Jan–. PMID: 30726003 Free Books & Documents.
-
[Association between obesity and the risk of microvascular complications in Yinzhou District, Ningbo adults with type 2 diabetes mellitus].Wei Sheng Yan Jiu. 2025 Jul;54(4):608-620. doi: 10.19813/j.cnki.weishengyanjiu.2025.04.012. Wei Sheng Yan Jiu. 2025. PMID: 40695761 Chinese.
-
Preexisting Diabetes and Pregnancy: An Endocrine Society and European Society of Endocrinology Joint Clinical Practice Guideline.Eur J Endocrinol. 2025 Jun 30;193(1):G1-G48. doi: 10.1093/ejendo/lvaf116. Eur J Endocrinol. 2025. PMID: 40652450
-
Adefovir dipivoxil and pegylated interferon alfa-2a for the treatment of chronic hepatitis B: a systematic review and economic evaluation.Health Technol Assess. 2006 Aug;10(28):iii-iv, xi-xiv, 1-183. doi: 10.3310/hta10280. Health Technol Assess. 2006. PMID: 16904047
-
Quality improvement strategies for diabetes care: Effects on outcomes for adults living with diabetes.Cochrane Database Syst Rev. 2023 May 31;5(5):CD014513. doi: 10.1002/14651858.CD014513. Cochrane Database Syst Rev. 2023. PMID: 37254718 Free PMC article.
References
Associated data
LinkOut - more resources
Full Text Sources
Miscellaneous