. 2023 Feb 9:3:893366.
doi: 10.3389/fsysb.2023.893366. eCollection 2023.

Clonal abundance patterns in hematopoiesis: Mathematical modeling and parameter estimation

Affiliations

Clonal abundance patterns in hematopoiesis: Mathematical modeling and parameter estimation

Yunbei Pan et al. Front Syst Biol. .

Abstract

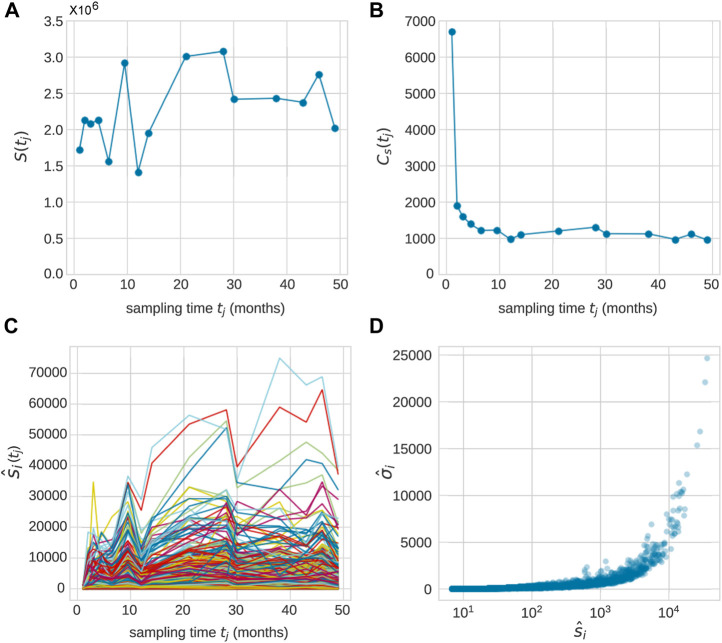
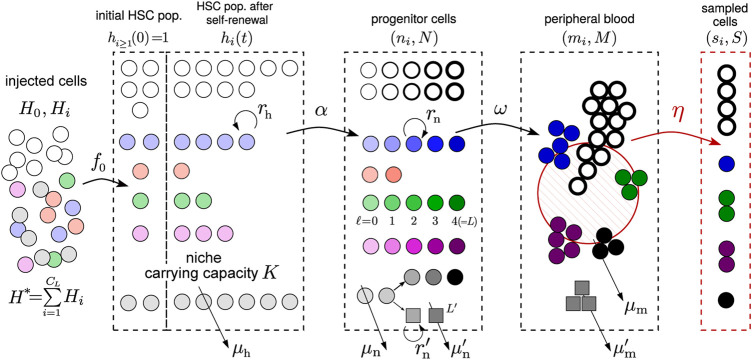
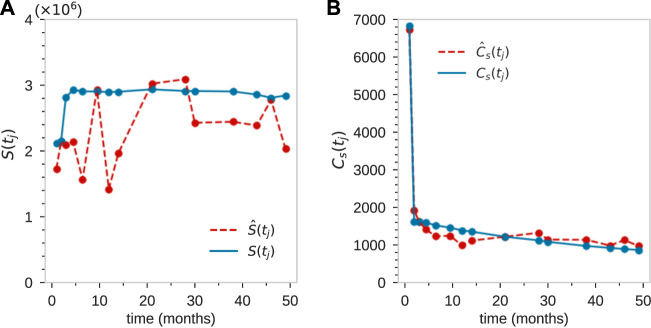
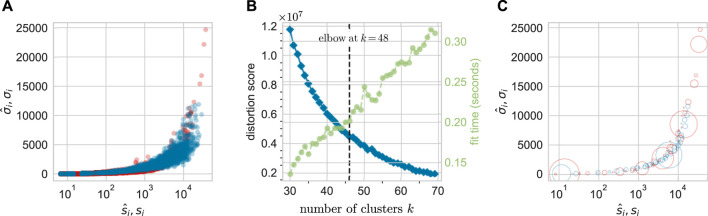
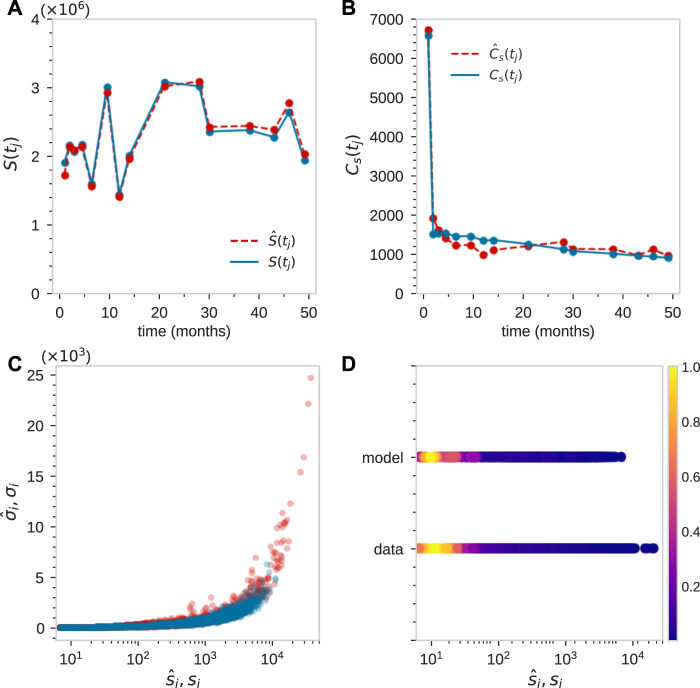
Hematopoiesis has been studied via stem cell labeling using barcodes, viral integration sites (VISs), or in situ methods. Subsequent proliferation and differentiation preserve the tag identity, thus defining a clone of mature cells across multiple cell type or lineages. By tracking the population of clones, measured within samples taken at discrete time points, we infer physiological parameters associated with a hybrid stochastic-deterministic mathematical model of hematopoiesis. We analyze clone population data from Koelle et al. (Koelle et al., 2017) and compare the states of clones (mean and variance of their abundances) and the state-space density of clones with the corresponding quantities predicted from our model. Comparing our model to the tagged granulocyte populations, we find parameters (stem cell carrying capacity, stem cell differentiation rates, and the proliferative potential of progenitor cells, and sample sizes) that provide reasonable fits in three out of four animals. Even though some observed features cannot be quantitatively reproduced by our model, our analyses provides insight into how model parameters influence the underlying mechanisms in hematopoiesis. We discuss additional mechanisms not incorporated in our model.

Keywords: barcodes; clonal tracking; differentiation; hematopoiesis; stem cells.


Conflict of interest statement

The authors declare that the research was conducted in the absence of any commercial or financial relationships that could be construed as a potential conflict of interest.

Figures

FIGURE 1
FIGURE 1
After transplantation, peripheral blood samples were taken across J time points t j , j = 1, …, (J). Typically, measurements were taken over 20–49 months and J = 10 − 15. (A) The total population S^(tj) of granulocytes sampled from animal ZH33 (Koelle et al., 2017) at times t j = (1, 2, 3, 4.5, 6.5, 9.5, 12, 14, 21, 28, 30, 38, 43, 46, 49) months. (B) The total richness in each sample, C^s(tj) . The richness at the first two time samples are large (as we shall see, due to transplantation of barcoded progenitor cells). After the first two time points, where the richness will arise from the richness of the transplanted HSCs, the typical richness at each time point C^s(tj2)1000 , while the richness across all J − 2 time points (for t j > 2 months) is C^s>2=2335 . Across all J time points, 9,221 unique granulocyte clones were detected (out of a total of 25325 across all cell types). The individual clone abundances in the sampled granulocyte population are shown in (C) where the abundances of clone i in a sample taken at time t j are denoted by s^i(tj) . The mean and standard deviation σ^i of the abundances of all clones across all sampling times are calculated using Eq. 1 and scatter-plotted in (D). Each point represents one of the 2,335 detected granulocyte clones.
FIGURE 2
FIGURE 2
Schematic of the hybrid stochastic-deterministic model. Tagged (barcoded) stem cells are transplanted into an animal initially with one cell (h i (t = 0) ≈ 1) per clone. These cells, together with the untagged ones (h 0(t = 0) ≫ 1) then undergo self-renewal and death, at rates rhh(t)=i=0hi(t) and μ h, respectively, in the bone marrow. HSCs in all clones are also assumed to undergo asymmetric differentiation with rate α, forming a zeroth-generation progenitor cells. The population of th-generation (or stage) progenitor cells, denoted ni() , further symmetrically differentiate with each division, up to a maximum of = L generations. The final-generation cell in clone i with population ni(L) can then undergo terminal differentiation at rate ω to form mature, circulating peripheral blood cells. Mature cells at population m i are then randomly sampled (with sampling fraction η and generating a sample population s i ) and sequenced. We wish to infer some of the parameters of the model by comparing the predicted means, standard deviations, and clone number densities with those from data (Figure 1). Lineage differentiation is schematically shown as a splitting of the grey clone between generations = 1 and = 2, where a new cell type (squares) branches off. The division and death rates of progenitor cells in this new lineage, rn and μn , may be different, as may the maximum number of generations L′. The mature cells turn over with rate a μ m that may depend on lineage (but not clone identity within each lineage). In this paper, we assume that the lineages diverge at the zeroth-generation progenitor cell and analyze the model after the first differentiation step (rate α) independently for different cell types (in this paper, granulocytes).
FIGURE 3
FIGURE 3
(A) The population m i (t) of mature cells resulting from a single HSC differentiation event as obtained from Eq. 12. (B) Multiple concatenated bursts from a low-population HSC clone showing well-separated intermittent pulses obtained via Eq. 13. (C) When the HSC population of a clone is large, the resulting mature cell population bursts merge together and exhibit lower relative variability.
FIGURE 4
FIGURE 4
Schematic of a mixed HSC/HSPC initial condition. The transplanted CD34+ cells contain HSCs and some progenitor cells (HSPCs), which are exhausted after about 2 months. The remaining richness arises mainly from that of the long term HSCs C h(0) which then slowly decreases as certain HSC clones become extinct.
FIGURE 5
FIGURE 5
For animal ZH33, coarse fitting to the total population of tagged granulocytes S(t j ) (A), and the total number of clones at each time point C s(t j ) (B). This initial rough matching was achieved using parameter values L = 22, r n ≈ 2, ω ≈ 0.2, and sampling size η = 10–5.
FIGURE 6
FIGURE 6
A total of 48 clusters are identified via k-means clustering of the data from animal ZH33. (A) The unclustered (s^i,σ^i) data and model predictions for an arbitrary set of parameters. (B) The squared errors in k-means clustering or distortion score (blue) and convergence time (green) as a function of the number of clusters. The optimal value from the elbow signalling diminishing returns was found in this case to be k* = 48. (C) The location of the cluster centers plotted on the (s^,σ^) plane. The radius of each circle indicates the fraction of all clones w k that are associated with cluster k and is set to 2000w k .
FIGURE 7
FIGURE 7
Fitting of tagged granulocyte populations for animal ZH33 after time-dependent adjustment of sampling size η(t j ). For this animal t j = [1, 2, 3, 4.5, 6.5, 9.5, 12, 14, 21, 28, 30, 38, 43, 46, 49] months. (A) By initially best-matching S(t j ), we find η(t j ) = [1, 2.03, 1.07, 0.94, 0.68, 1.25, 0.61, 0.83, 1.29, 1.29, 1.01, 1.01, 0.99, 1.14, 0.83]×10–5. (B–D) By searching parameter space to find a good match to C^s(tj),s^i,σ^i , and ρ^ (which is shown with its maximum nnormalized to one), which is plotted with its maximum normalized to unity. We find parameters [in units of/day] that fit the data are μ h = 0.02, r h(0) = 0.08, C h(0) = 2500, C n( = 0) = 800, C n( = 1) = 1600, C n( = 2) = 3200, K = 2.5×10⁵, α = 0.016, r n = 2, L = 22, μ n = 0, μ m = 0.185 and ω = 0.2.

Similar articles

References

    1. Abbuehl J. P., Tatarova Z., Held W., Huelsken J. (2017). Long-term engraftment of primary bone marrow stromal cells repairs niche damage and improves hematopoietic stem cell transplantation. Cell. Stem Cell. 21, 241–255. 10.1016/j.stem.2017.07.004 - DOI - PubMed
    1. Abkowitz J. L., Catlin S. N., Guttorp P. (1996). Evidence that hematopoiesis may be a stochastic process in vivo . Nat. Med. 2, 190–197. 10.1038/nm0296-190 - DOI - PubMed
    1. Attar A. (2014). Changes in the cell surface markers during normal hematopoiesis: A guide to cell isolation. Glob. J. Hematol. Blood Transfus. 1, 20–28. 10.15379/2408-9877.2014.01.01.4 - DOI
    1. Biasco L., Pellin D., Scala S., Dionisio F., Basso-Ricci L., Leonardelli L., et al. (2016). In vivo tracking of human hematopoiesis reveals patterns of clonal dynamics during early and steady-state reconstitution phases. Cell. Stem Cell. 19, 107–119. 10.1016/j.stem.2016.04.016 - DOI - PMC - PubMed
    1. Bortz A. B., Kalos M. H., Lebowitz J. L. (1975). A new algorithm for Monte Carlo simulation of ising spin systems. J. Comput. Phys. 17, 10–18. 10.1016/0021-9991(75)90060-1 - DOI

LinkOut - more resources