. 2023 Dec 5:3:1274184.
doi: 10.3389/fsysb.2023.1274184. eCollection 2023.

The development of an ingestible biosensor for the characterization of gut metabolites related to major depressive disorder: hypothesis and theory

Affiliations

The development of an ingestible biosensor for the characterization of gut metabolites related to major depressive disorder: hypothesis and theory

Amanda Densil et al. Front Syst Biol. .

Abstract

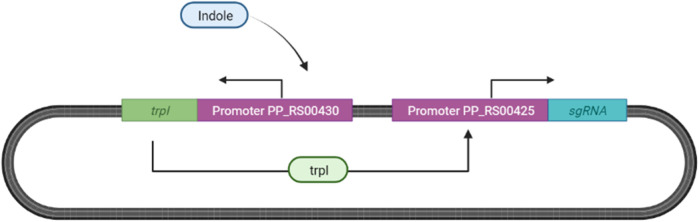
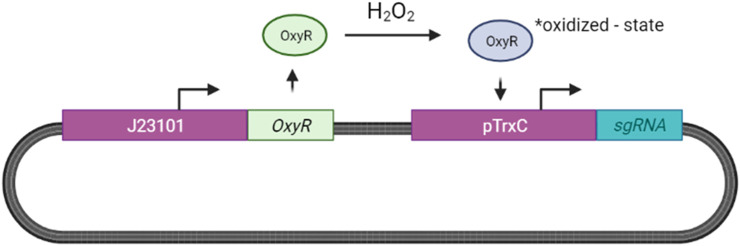
The diagnostic process for psychiatric conditions is guided by the Diagnostic and Statistical Manual of Mental Disorders (DSM) in North America. Revisions of the DSM over the years have led to lowered diagnostic thresholds across the board, incurring increased rates of both misdiagnosis and over-diagnosis. Coupled with stigma, this ambiguity and lack of consistency exacerbates the challenges that clinicians and scientists face in the clinical assessment and research of mood disorders such as Major Depressive Disorder (MDD). While current efforts to characterize MDD have largely focused on qualitative approaches, the broad variations in physiological traits, such as those found in the gut, suggest the immense potential of using biomarkers to provide a quantitative and objective assessment. Here, we propose the development of a probiotic Escherichia coli (E. coli) multi-input ingestible biosensor for the characterization of key gut metabolites implicated in MDD. DNA writing with CRISPR based editors allows for the molecular recording of signals while riboflavin detection acts as a means to establish temporal and spatial specificity for the large intestine. We test the feasibility of this approach through kinetic modeling of the system which demonstrates targeted sensing and robust recording of metabolites within the large intestine in a time- and dose- dependent manner. Additionally, a post-hoc normalization model successfully controlled for confounding factors such as individual variation in riboflavin concentrations, producing a linear relationship between actual and predicted metabolite concentrations. We also highlight indole, butyrate, tetrahydrofolate, hydrogen peroxide, and tetrathionate as key gut metabolites that have the potential to direct our proposed biosensor specifically for MDD. Ultimately, our proposed biosensor has the potential to allow for a greater understanding of disease pathophysiology, assessment, and treatment response for many mood disorders.

Keywords: gene editing; gut brain axis; gut microbiome; ingestible biosensor; major depressive disorder; personalized healthcare.


Conflict of interest statement

The authors declare that the research was conducted in the absence of any commercial or financial relationships that could be construed as a potential conflict of interest. The author(s) declared that they were an editorial board member of Frontiers, at the time of submission. This had no impact on the peer review process and the final decision.

Figures

FIGURE 1
FIGURE 1
Overview of proposed ingestible biosensor system. The process begins with oral administration of the encapsulated biosensor containing engineered bacteria to an individual with MDD (step 1). Upon ingestion, direct surveillance and recording of target gut metabolites can occur in the large intestine due to riboflavin specificity (step 2). Leveraging AND gate functionality allows for BE2, sgRNAs and the metabolite receptor sensing systems to be transcribed, and for base editing to create point mutations in the recording plasmids (step 3). After excretion of the biosensor, the encoded mutations are subject to analysis via sequencing to extract information concerning target metabolite concentrations in relation to MDD (step 4).
FIGURE 2
FIGURE 2
Pathogenesis of MDD in relation to the gut brain axis. Chronic stress can result in the dysregulation of several pathways that to lead to MDD including: (A) LPS binding to TLR-4 on the nodose ganglion, (B) inflammation of peripheral tissues and increased activity of pro-inflammatory cytokines and immune cells, (C) LPS-induced dysregulation of hippocampal BDNF and neuronal signaling by NMDA-receptors (D) disruption of IEB integrity, translocation of LPS, and elevated pathogenic bacterial concentrations in the gut allowing. Furthering a devastating cycle that exacerbates the severity and persistence of MDD.
FIGURE 3
FIGURE 3
Proposed biosensor system design for the molecular reading and recording of metabolites. (A) An overview of the system as a whole, (B) the plasmid design for the LEE1 promoter (PLEE1), metabolite promoter, and the constitutively active promoter which transcribes the individual metabolite receptor sensing systems, (C) a flowchart of important events: (1) riboflavin induces the production of BE2 and sgRNA1 upon entry to the large intestine, and simultaneously, (2) the presence of a metabolite of interest induces the production of sgRNA2, then (3) the sgRNAs can dimerize with BE2 to (4) induce gene editing via point mutations.
FIGURE 4
FIGURE 4
Overview of riboflavin-inducible sensing system to achieve large intestine specificity. Riboflavin in the large intestine induces HK, resulting in the autophosphorylation of the histidine residue in the RR protein. The phosphorylated RbfR undergoes a confirmation change that enables for specific binding to the LEE1 promoter.
FIGURE 5
FIGURE 5
System response in typical large intestine conditions. Initial riboflavin concentration is 22.8 μM and initial indole concentration is 2.59 mM sgRNA1, BE2_Complex_1, and Edited_Plasmids_1 represent the riboflavin-associated species and Ratio_1 represents the base editing ratio of the riboflavin-associated recording site; sgRNA2, BE2_Complex_2, and Edited_Plasmids_2 are the indole associated species and Ratio_2 represents the base editing ratio of the indole-associated recording site.
FIGURE 6
FIGURE 6
Base editing ratio of the indole-associated recording site under four test cases. (A) Both riboflavin and indole are absent. (B) Riboflavin is present at an initial concentration of 22.8 μM, while indole is absent. (C) Indole is present at an initial concentration of 2.59 mM, while riboflavin is absent. (D) Both riboflavin and indole are present in normal large-intestinal concentrations: initial riboflavin concentration is 22.8 μM, initial indole concentration is 2.59 mM.
FIGURE 7
FIGURE 7
Effect of varying concentrations of riboflavin and indole on final base editing ratios. Ratio_1 is the base editing ratio of the riboflavin-associated recording site, and Ratio_2 is the base editing ratio of the indole-associated recording site. (A) 10-h simulation with constant initial concentration of riboflavin and varying initial concentrations of indole. Initial indole concentrations varied from 0.3 mM to 6.64 mM. (B) 10-h simulation with constant initial concentration of indole and varying initial concentrations of riboflavin. Initial indole concentrations were set to 2.59 mM. Initial riboflavin concentrations varied from 0 μM to 45.6 μM, which is the 0%–200% range of typical colonic riboflavin concentrations in mice, 22.8 μM (Liu et al., 2022).
FIGURE 8
FIGURE 8
50-h simulation with constant initial concentration of riboflavin and varying initial concentrations of indole (0.30 mM–6.64 mM). Ratio_1 is the base editing ratio of the riboflavin-associated recording site, and Ratio_2 is the base editing ratio of the indole-associated recording site.
FIGURE 9
FIGURE 9
Results of normalization model for a 10-h simulation. (A) Logarithmic relationship between raw base-editing ratio at the indole site, and variations in indole concentrations from 0.3 mM to 6.64mM, and (B) variations in riboflavin concentrations from 0% to 200% of 22.8uM. (C) Comparison between actual indole concentrations and indole levels predicted after normalization. Riboflavin concentrations are constant, and units on the y-axis are arbitrary. (D) Predicted indole concentrations after normalization for various riboflavin concentrations. Actual indole concentrations are constant, and units on the y-axis are arbitrary.
FIGURE 10
FIGURE 10
Butyrate Sensing in Escherichia coli Nissle 1917 (EcN, serotype O6:K5:H1). (A) Butyrate and the leucine-responsive regulatory protein (Lrp) form a binary complex which binds to the promoter region of PchA (pPchA) (Henker et al., 2008; Gaudier et al., 2009). In the system by Bai and Mansell, 2020, PchA subsequently binds to the LEE1 promoter that then natively initiates the transcription of the gene of interest (Bai and Mansell, 2020). (B) Butyrate sensing system adopted from Serebrinsky-Duek et al., 2023, to avoid coactivation of the riboflavin system, with the reporter gene (sgRNA) directly downstreamof pPchA (Serebrinsky-Duek et al., 2023).
FIGURE 11
FIGURE 11
Indole Sensing in Escherichia coli. Indole binds to PP_RS00430, inducing the expression of transcription factor (TrpI) allowing for the expression of tryptophan synthase subunits, now substituted with sgRNA located after the promoter PP_RS00425 (Matulis et al., 2022).
FIGURE 12
FIGURE 12
H2O2 Sensing in E. coli. Increased H2O2 levels result in the activation of the OxyR protein, resulting in the formation of a disulfide bond between two OxyR cysteine residues (Matulis et al., 2022). This activated OxyR state results in the activation of the TrxC promoter (pTrxC), leading to sgRNA expression.
FIGURE 13
FIGURE 13
Tetrahydrofolate Responsive Riboswitch System in E. coli. Endogenous E. coli RNA polymerase binds to the constitutive J23101 promoter, transcribing the THF riboswitch. THF present then binds to the riboswitch terminating the expression of the tet repressor (TetR), leading to the transcription of sgRNA after the promoter tetA (Leigh, 2015; Das et al., 2016). In the absence of THF the repressor is expressed and inhibits sgRNA expression.
FIGURE 14
FIGURE 14
Overview of Tetrathionate Sensor. In the presence of tetrathionate, TtrS is phosphorylated, allowing for the phosphorylation and dimerization of ttrR. ttrR binds to the ttrB promoter in the tetrathionate reductase operon (ttrBCA) to activate transcription of downstream genes which we have replaced with sgRNA (Hensel et al., 1999; Daeffler et al., 2017).

Similar articles

References

    1. Addolorato G., Capristo E., Stefanini G. F., Gasbarrini G. (1997). Inflammatory bowel disease: a study of the association between anxiety and depression, physical morbidity, and nutritional status. Scand. J. Gastroenterology 32 (10), 1013–1021. 10.3109/00365529709011218 - DOI - PubMed
    1. Akoglu B., Schrott M., Bolouri H., Jaffari A., Kutschera E., Caspary W. F., et al. (2008). The folic acid metabolite L-5-methyltetrahydrofolate effectively reduces total serum homocysteine level in orthotopic liver transplant recipients: a double-blind placebo-controlled study. Eur. J. Clin. Nutr. 62, 796–801. 10.1038/SJ.EJCN.1602778 - DOI - PubMed
    1. Alexakis C., Kumar S., Saxena S., Pollok R. (2017). Systematic review with meta-analysis: the impact of a depressive state on disease course in adult inflammatory bowel disease. Aliment. Pharmacol. Ther. 46, 225–235. 10.1111/apt.14171 - DOI - PubMed
    1. Almario C. V., Megana L., Ballal W. D. C., Nordstrom C., Khanna D., Spiegel B. M. R. (2018). Burden of gastrointestinal symptoms in the United States: results of a nationally representative survey of over 71,000 Americans. Am. J. Gastroenterology 113 (11), 1701–1710. 10.1038/s41395-018-0256-8 - DOI - PMC - PubMed
    1. Al-Sadi R. M., Ma T. Y. (2007). IL-1beta causes an increase in intestinal epithelial tight junction permeability. J. Immunol. 178, 4641–4649. 10.4049/JIMMUNOL.178.7.4641 - DOI - PMC - PubMed

LinkOut - more resources