. 2025 Aug 5:53:789-800.
doi: 10.1016/j.bioactmat.2025.07.051. eCollection 2025 Nov.

Timed photothermal therapy combining fluorescence-on chemotherapy maximizes tumor treatment

Affiliations

Timed photothermal therapy combining fluorescence-on chemotherapy maximizes tumor treatment

Runqun Tang et al. Bioact Mater. .

Abstract

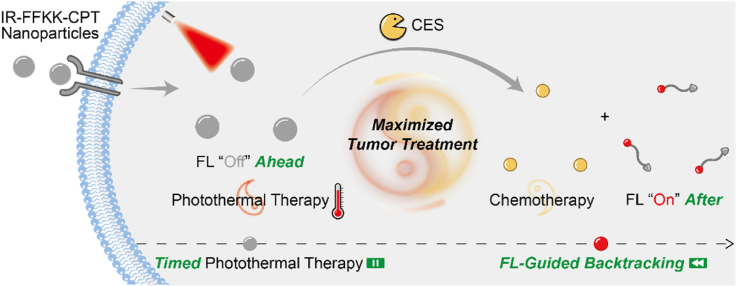
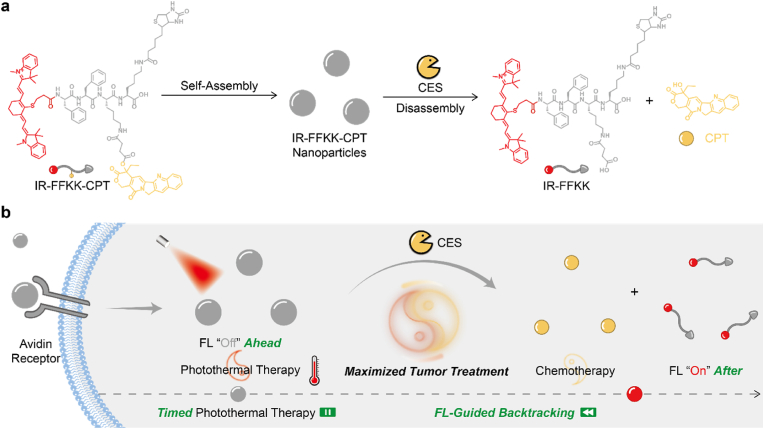
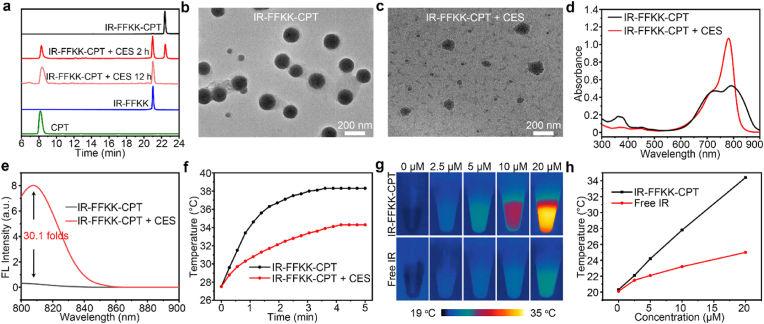
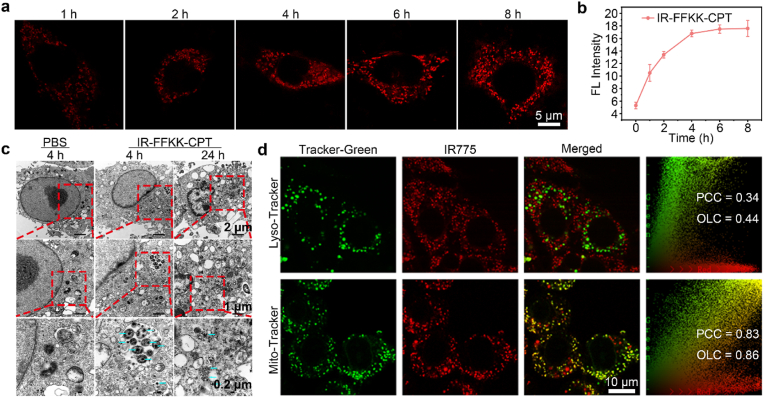
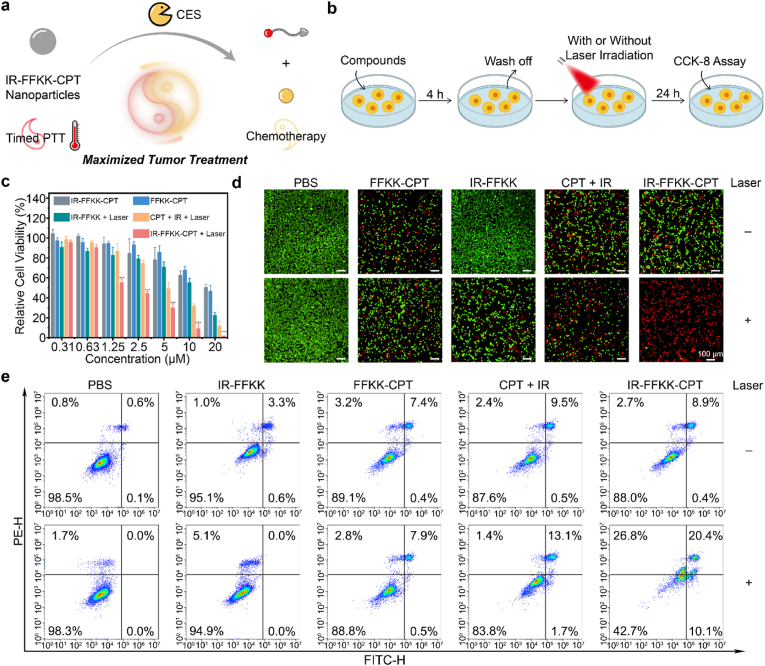
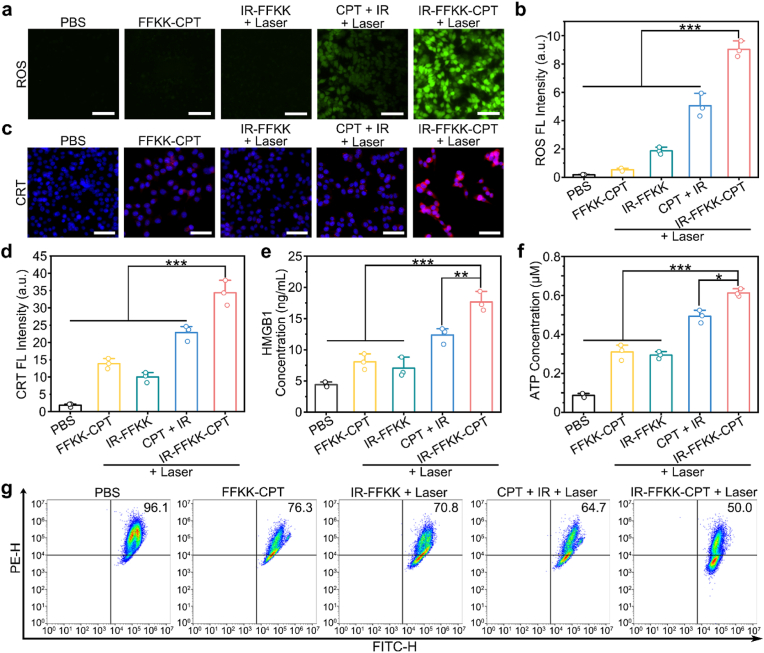
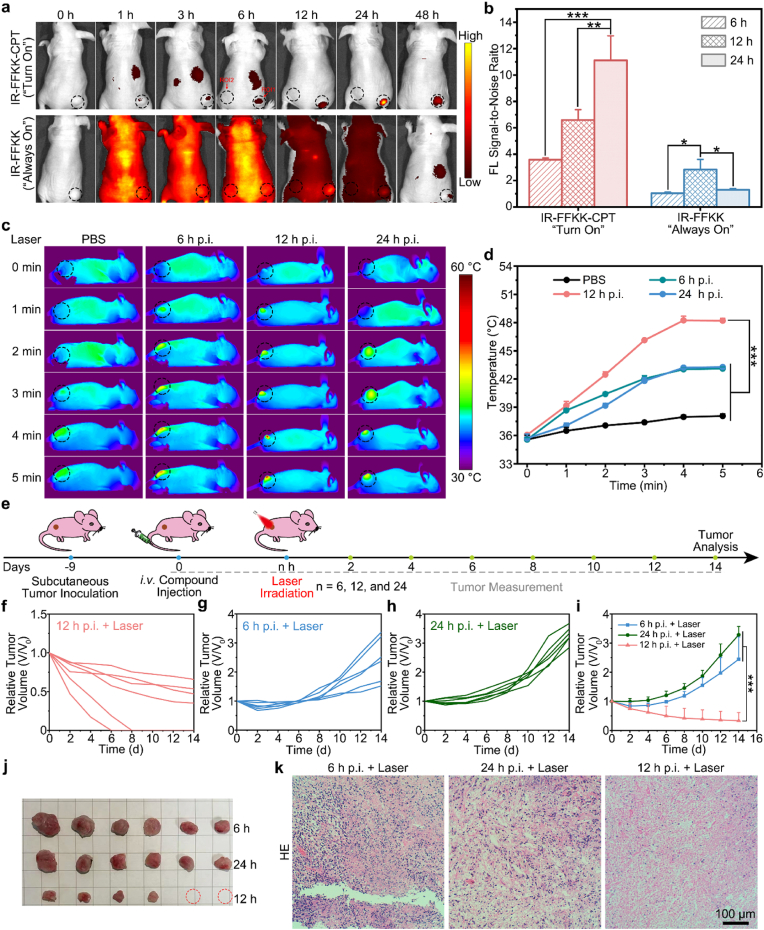
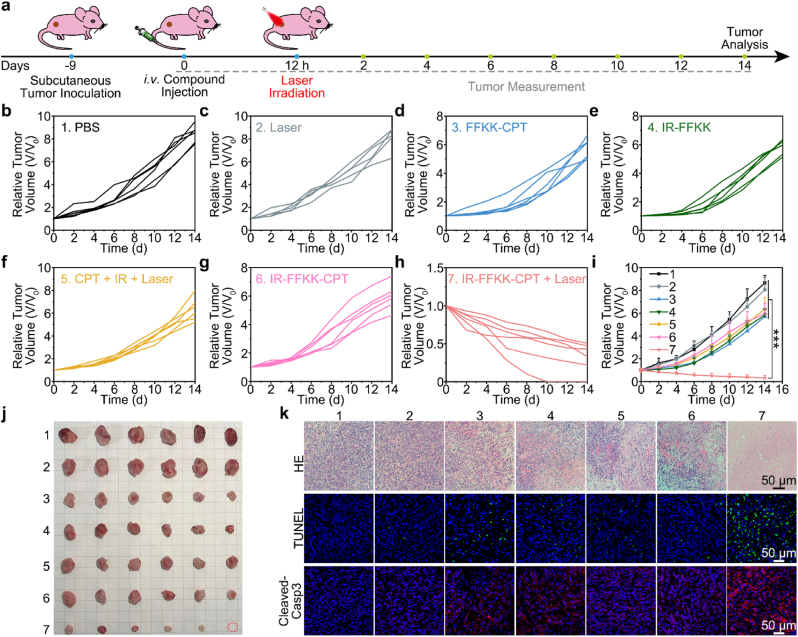
Photothermal therapy (PTT) combined with chemotherapy is a promising strategy for tumor treatment. However, its efficacy is often limited by the uncertainty of the irradiation timing of the photothermal agent. Herein, we rationally designed a self-assembling peptide-drug conjugate, IR775-Phe-Phe-Lys(CPT)-Lys(Biotin)-OH (IR-FFKK-CPT), which spontaneously self-assembles into fluorescence (FL)-quenched nanoparticles with high photothermal conversion efficiency. After being uptaken by the cancer cells, the nanoparticles are hydrolysed by carboxylesterase and disassembled to release CPT, turning the FL "On". The "On" FL displays not only the initiation of chemotherapy but also the decline of PTT efficacy. By leveraging the "On" FL as a temporal indicator, we precisely backtrack the optimal cell/tumor irradiation timing to be 4 h/12 h post-incubation/injection in cells/tumors. Subsequent therapeutic studies demonstrated that the timed irradiation on tumor at 12 h post injection significantly maximized tumor treatment outcomes, with average relative tumor volume on day 14 reduced to 13.7 % or 10.2 % of that in the groups of 6 h or 24 h, respectively. Guided by this timed PTT, IR-FFKK-CPT achieved an excellent tumor growth inhibition rate of 96.2 %, significantly outperforming the four positive control groups which showed tumor inhibition rates of 26.3 %-34.1 %. Our self-regulating theranostic strategy, that synchronizes timed PTT with visualized chemotherapy to maximize tumor treatment, provides people with a promising approach for precise tumor therapy.

Keywords: Chemotherapy; Disassembly; Irradiation timing; Nanoparticle; Photothermal therapy.


Conflict of interest statement

The authors declare that they have no known competing financial interests or personal relationships that could have appeared to influence the work reported in this paper.

Figures

Image 1
Graphical abstract
Scheme 1
Scheme 1
(a) Molecular design of IR-FFKK-CPT nanoparticles, their CES-triggered disassembly to yield hydrophilic product IR-FFKK and CPT. (b) Schematic illustration of the mechanism of FL-guided backtracking of the optimal irradiation timing for combinational PTT with chemotherapy to maximize tumor treatment.
Fig. 1
Fig. 1
(a) HPLC traces of 10 μM IR-FFKK-CPT after incubation with 20 U mL−1 CES at 37 °C for 2 h or 12 h in PBS (pH 7.4). Wavelength for detection: 254 nm. (b) TEM images of 10 μM IR-FFKK-CPT and (c) 10 μM IR-FFKK-CPT after incubation with 20 U mL−1 CES at 37 °C for 2 h in PBS (pH 7.4). (d) Absorption and (e) FL spectra of 10 μM IR-FFKK-CPT before and after incubation 20 U mL−1 CES at 37 °C for 2 h in PBS (pH 7.4). (f) Temperature-rising curves of 10 μM IR-FFKK-CPT with (or w/o) CES upon laser irradiation at 808 nm (5 min, 1 W cm−2). (g) Thermal images of IR-FFKK-CPT and free IR775 at different compound concentrations after laser irradiation at 808 nm (5 min, 1 W cm−2). (h) Quantitative temperature analyses of thermal images in g.
Fig. 2
Fig. 2
(a) Confocal fluorescence images of 4T1 cells after incubation with 10 μM IR-FFKK-CPT nanoparticles at different time points. (b) Quantitative analyses of the FL intensities at different time points in a by flow cytometry (mean ± SD, n = 3). (c) Bio-TEM images of 4T1 cells after treatments with PBS at 4 h or 10 μM IR-FFKK-CPT nanoparticles at 4 h or 24 h. (d) Co-localization detection in 4T1 cells after incubation with 10 μM IR-FFKK-CPT nanoparticles for 4 h. The 4T1 cells were co-stained with Lyso-Tracker or Mito-Tracker.
Fig. 3
Fig. 3
(a) Illustration of maximized tumor treatment of combinational therapy with IR-FFKK-CPT nanoparticles. (b) Cartoon flowchart of CCK-8 assay. (c) Cell viabilities of 4T1 cells after different treatments as indicated (mean ± SD, n = 6, ∗∗∗P < 0.001). (d) Live/dead staining of 4T1 cells after different treatments. (e) Flow cytometry analyses of apoptosis/necrosis in 4T1 cells in each group.
Fig. 4
Fig. 4
(a) Detection of ROS levels in 4T1 cells with DCFH-DA after incubation with PBS, 5 μM FFKK-CPT, 5 μM IR-FFKK, 5 μM CPT + 5 μM IR, or 5 μM IR-FFKK-CPT nanoparticles. Specifically, the IR-FFKK, CPT + IR, and IR-FFKK-CPT groups were irradiated by 808 nm laser (5 min, 1 W cm−2) after 4 h incubation. Scale bar: 50 μm. (b) Relative FL intensity of DCFH-DA in a (mean ± SD, n = 3, ∗∗∗P < 0.001). (c) Images of calreticulin (CRT) immunofluorescence-staining in 4T1 cells after different treatments identical with those in a. Scale bar: 50 μm. (d) Quantitative analysis of CRT FL intensity in c (mean ± SD, n = 3, ∗∗∗P < 0.001). Quantitative results of released (e) HMGB1 and (f) ATP from 4T1 cells after different treatments identical with those in a (mean ± SD, n = 3, ∗P < 0.01, ∗∗P < 0.005, and ∗∗∗P < 0.001). (g) Detection of mitochondrial membrane potential using JC-1 probes via flow cytometry analysis after different treatments identical with those in a.
Fig. 5
Fig. 5
(a) Fluorescence images of 4T1 tumor-bearing mice after intravenous injection of 0.05 μmol kg−1IR-FFKK-CPT nanoparticles (“Turn On” group) or IR-FFKK (“Always On” group) at different time points. (b) SNRs of FL intensity at 6, 12, and 24 h p.i. in a, calculated by ROI1/ROI2. ROI1 represents the right leg circle area (tumor area), and ROI2 represents the left hind leg area (healthy tissue) in each photo, respectively (mean ± SD, n = 3, ∗P < 0.05, ∗∗P < 0.01, and ∗∗∗P < 0.001). (c) Representative thermal images of mice exposed to laser (808 nm, 1 W cm−2) after intravenous injection of PBS or IR-FFKK-CPT nanoparticles at different time points. (d) Quantitative temperature changing curves at tumor sites of each mouse in c. (e) Schematic illustration of subcutaneous 4T1 tumor implantation, compound injection, laser irradiation, and tumor analysis. Changing curves of relative tumor volume of 4T1 tumor-bearing mice after drug injection, and tumor tissues were irradiated by laser (808 nm, 1 W cm−2) at different time points as 12 h p.i. (f), 6 h p.i. (g) and 24 h p.i. (h). (i) Quantitative analyses of the relative tumor volume of mice irradiated at 6 h, 24 h, and 12 h during the 14-day period (mean ± SD, n = 6, ∗∗∗P < 0.001) (j) Photographs of excised tumors from mice irradiated at 6 h, 24 h, and 12 h at 14 d. (k) HE images of the tumor sections from mice irradiated at 6 h, 24 h, and 12 h at 14 d.
Fig. 6
Fig. 6
(a) Schematic illustration of subcutaneous 4T1 tumor implantation, compound injection, laser irradiation, and tumor analysis. (b–h) Changing curves of relative tumor volume of 4T1 tumor-bearing mice after different treatments as indicated. (i) Quantitative analyses of the relative tumor volume of mice in different groups (mean ± SD, n = 6, ∗∗∗P < 0.001). (j) Photographs of the excised tumors from mice in different groups at 14 d. (k) HE images, TUNEL staining, and Cleaved-Casp3 immunofluorescence staining of the excised tumors from the mice in different groups at 14 d.

Similar articles

References

    1. Arafeh R., Shibue T., Dempster J.M., Hahn W.C., Vazquez F. The present and future of the cancer dependency map. Nat. Rev. Cancer. 2025;25(1):59–73. - PubMed
    1. Tannock I.F. Conventional cancer therapy: promise broken or promise delayed? Lancet. 1998;351:SII9–SII16. - PubMed
    1. Wyld L., Audisio R.A., Poston G.J. The evolution of cancer surgery and future perspectives. Nat. Rev. Clin. Oncol. 2015;12(2):115–124. - PubMed
    1. De Ruysscher D., Niedermann G., Burnet N.G., Siva S., Lee A.W.M., Hegi-Johnson F. Radiotherapy toxicity. Nat. Rev. Dis. Primers. 2019;5(1):13. - PubMed
    1. Chabner B.A., Roberts T.G. Chemotherapy and the war on cancer. Nat. Rev. Cancer. 2005;5(1):65–72. - PubMed

LinkOut - more resources