. 2025 Jul 30:13:1613353.
doi: 10.3389/fpubh.2025.1613353. eCollection 2025.

A scoping review and evidence map of radiofrequency field exposure and genotoxicity: assessing in vivo, in vitro, and epidemiological data

Affiliations

A scoping review and evidence map of radiofrequency field exposure and genotoxicity: assessing in vivo, in vitro, and epidemiological data

Steven G Weller et al. Front Public Health. .

Abstract

Background: Studies investigating genotoxic effects of radiofrequency electromagnetic field (RF-EMF) exposure (3 kHz-300 GHz) have used a wide variety of parameters, and results have been inconsistent. A systematic mapping of existing research is necessary to identify emerging patterns and to inform future research and policy.

Methods: Evidence mapping was conducted using guidance from the Preferred Reporting Items for Systematic reviews and Meta-Analyses for Scoping Reviews (PRISMA-ScR). A comprehensive search strategy was applied across multiple research databases, using specific inclusion and exclusion criteria within each knowledge domain. Quantitative aggregation using tables, graphs and heat maps was used to synthesize data according to study type, organism type, exposure level and duration, biological markers (genotoxicity, cellular stress, apoptosis), RF-EMF signal characteristics, as well as funding source to further contextualize the evidence landscape. Quality criteria were applied as part of a focused analysis to explore potential biases and their effects on outcomes.

Results: Over 500 pertinent studies were identified, categorized as in vitro (53%), in vivo (37%), and epidemiological (10%), and grouped according to type of DNA damage, organism, intensity, duration, signal characteristics, biological markers and funding source. In vitro studies predominantly showed proportionally fewer significant effects, while in vivo and epidemiological studies showed more. DNA base damage studies showed the highest proportion of effects, as did studies using GSM talk-mode, pulsed signals and real-world devices. A complex relationship was identified between exposure intensity and duration, with duration emerging as a critical determinant of outcomes. A complex U-shaped dose-response relationship was evident, suggesting adaptive cellular responses, with increased free radical production as a plausible mechanism. Higher-quality studies showed fewer significant effects; however, the funding source had a stronger influence on outcomes than study quality. Over half (58%) of studies observing DNA damage used exposures below the International Commission of Non-Ionizing Radiation Protection (ICNIRP) limits.

Conclusion: The collective evidence reveals that RF-EMF exposures may be genotoxic and could pose a cancer risk. Exposure duration and real-world signals are the most important factors influencing genotoxicity, warranting further focused research. To address potential genotoxic risks, these findings support the adoption of precautionary measures alongside existing thermal-based exposure guidelines.

Keywords: apoptosis; cancer; electromagnetic radiation; genotoxicity; oxidative stress; radio frequencies; wireless technology.


Conflict of interest statement

The authors declare that the research was conducted in the absence of any commercial or financial relationships that could be construed as a potential conflict of interest.

Figures

Diagram showing various forms of genetic damage and alterations examined in the study. These include double- and single-strand DNA breaks, DNA base damage, mutations, micronuclei formation, nuclear bud changes, sister chromatid exchange, chromosomal aberrations, and spindle disturbances or conformational changes. Each row represents these types of genetic damage and alterations with illustrations.
Figure 1
Types of DNA damage reported due to RF exposure that is covered in the evidence map. Mutations can be associated with many of the types of DNA damage presented in this figure, but for the evidence map, they reflect results from specific mutation assays listed in Supplementary Table 1.
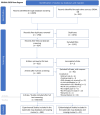
PRISMA 2020 flow diagram illustrating the identification and screening process of RF-EMF genotoxicity studies via databases. Initially, 2,878 records are identified through database searching, and 552 through other sources. After removing 1,674 duplicates, 1,756 records remain. Title and abstract screening excluded 1,132 records, leaving 624 articles. Full-text screening retrieves 622 articles, excluding two incomplete articles. Exclusion reasons for 92 articles include abstract-only, cooking studies, and others. Finally, 536 unique studies from 530 articles are included after screening, with 484 experimental and 52 epidemiological studies used in the systematic map database and scoping review.
Figure 2
PRISMA 2020 flow diagram (35) for the RF-EMF genotoxicity systemic map. Note six of the 530 articles contained two studies resulting in 536 studies for review.
A figure that consists of two components: (A) a world map with pie charts indicating the number of DNA damage papers by country with larger pie charts represent more papers. Two colors are used to represent the balance of evidence (orange and grey for DNA damage outcomes: effect, no effect respectively). (B) a stacked area chart showing the number of DNA damage papers published from the late 1950's to 2025. Peaks appear from 1995 to 2020, with shaded areas representing different outcomes: effect (orange), no effect (gray), and possible effect (purple).
Figure 3
(A) RF-EMF genotoxicity research outcomes by country and (B) by date of publication.
Two complex donut charts that compare the effects of DNA damage across studies types (in vitro, in vivo and epidemiological) for “All Studies” and “Higher quality experimental Studies”. In chart A, labeled “All Studies,” 517 studies are categorized into Epidemiological (10%), in vitro (53%), and in vivo (37%), with an overall balance of evidence showing 59% effect studies and 41% no effect. Chart B, labeled ‘Higher Quality Experimental Studies,” involves 130 studies, divided into in vitro (64%) and in vivo (36%), with the balance of evidence showing 48% effect and 52% no effect. The color key includes purple for epidemiological (Epi) studies, blue for in vitro studies, and green for in vivo studies, with orange indicating a statistically significant effect and gray indicating no effect.
Figure 4
Overall balance of evidence for (A) DNA damage (all studies) and (B) higher quality experimental studies.
Twelve complex donut charts comparing studies on DNA damage effects. Each pair of charts from (A) to (L) represents a different DNA damage endpoint and compares in vitro, in vivo, as well as epidemiological studies, showing percentages of studies for each type of DNA damage versus no effect. The left column represents “All Studies” combined, while the right shows “Higher Quality Experimental Studies”. Colours are used to depict the balance of evidence with orange signifying statistically significant DNA damage and grey representing no effect. Sizes of chart segments reflect balance of evidence proportions along with study counts, with additional small pie graphs summarizing overall effect proportions.
Figure 5
Results for types of DNA damage: (A, B) DNA breaks/fragmentation, (C, D) DNA base damage, (E, F) chromosome aberrations, (G, H) micronuclei, (I, J) sister chromatid exchange and (K, L) mutations.
Two pair of complex donut charts compare the effects of potential DNA damage endpoints, namely DNA conformational change and apoptosis. Chart A: All Studies combined show 76% in vitro, 20% in vivo, and 4% Epidemiological studies, with an overall balance of evidence of 93% effect and 7% no effect for DNA conformational changes. Chart B: Higher Quality Experimental Studies show 88% in vitro, 13% in vivo, no Epidemiological studies, with a 100% effect for DNA conformational change. Chart C: Apoptosis Studies show 51% in vitro, 45% in vivo, and 3% Epidemiological studies, with an overall balance of evidence of 60% effect and 40% no effect. Chart D: Higher Quality Apoptosis Studies show 54% in vitro, 46% in vivo and no Epidemiological studies, with an overall balance of evidence of 50% effect and 50% no effect.
Figure 6
Results for indicators of potential DNA damage: (A, B) DNA conformational change and (C, D) apoptosis.
Line graph titled “DNA damage studies” displays the number of studies by frequency band (from 8 kHz to 130 GHz). The orange line plots the number of studies that found significant DNA damage, while a gray line shows the number of studies finding no significant damage. Prominent spikes, with percentages of studies reporting significant DNA damage, are noted at certain frequencies: 900 MHz (65%), 1800 MHz (72%), 2500 MHz (66%), and 3500–3599 MHz (56%). The proportion of studies with significant DNA damage as a percentage are labeled at each frequency band where there are more than 10 studies.
Figure 7
Number of studies in each frequency band and percentage of studies finding statistically significant DNA damage for the frequency bands where there were more than 10 studies.
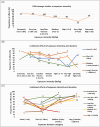
A multi panel graphical representation using line and bar charts show the proportion of studies finding DNA damage over time. Panel A is a line graph depicting the proportion of studies finding DNA damage effects (%) related to various exposure durations from acute to long-term. Panel B illustrates different types of DNA damage over an identical time bands (representing accumulated exposure durations), with lines depicting the proportion of studies finding DNA breaks, DNA base damage, chromosomal aberrations, micronuclei, spindle disturbance, and mutations. Panel C is a bar chart showing DNA damage types—DNA breaks, chromosomal aberrations, and micronuclei for longer exposure durations. Proportions of effects vary across studies, with numeric labels overlayed on lines indicating the number of studies showing statistically significant DNA damage effects at specific time intervals. Lines are only shown when there are 5 or more studies in each time interval.
Figure 8
DNA damage vs. exposure time (A) proportion of statistically significant DNA damage studies for each time bracket, with the number of studies for each bracket overlayed on the line. (B) Proportion of studies showing effects by type of DNA damage (C) Proportion of studies showing effects and DNA damage type for study duration 2 days or more.
A multi panel figure using line graphs to plot the proportion of studies finding statistically significant DNA damage by exposure intensity as well as by duration. Numbers are overlaid on the line represent the number of studies finding significant effects. (A) Line graph showing DNA damage studies versus exposure intensity, measured in W/kg. The proportion of studies finding effects decreases from extremely low (80% of 17 studies) to very high (33% of 22 studies) intensity exposure, then rises at extremely high intensity (58% of 59 studies). (B) Line graph illustrating combined effects of exposure intensity and duration on DNA damage. Proportions of studies finding statistically significant DNA damage are shown for acute (blue line), short (green line), medium (light orange line), and long (dark orange line) durations across various exposure intensities. Long exposures showed the highest proportion of studies finding DNA damage effects across different intensities and short exposures showing the least effects for most intensities. (C) Line graph showing combined effects of exposure duration and intensity. Proportions of studies showing statistically significant DNA damage are presented for different intensity levels across acute, short, medium, and long durations. A U-shaped dose response curve is seen for many of the intensity vs duration exposure combinations.
Figure 9
Proportion of studies showing (A) DNA damage effects vs. exposure intensity, overlaid with number of studies (B) exposure duration vs. exposure intensity and (C) exposure intensity vs. exposure duration. Graphs only show data where there were 5 or more studies in that category combination.
Three pairs of complex donut charts depict results from various mechanistic studies for “All studies” combined and “Higher Quality Experimental Studies”. Charts A and B show oxidative stress studies with 118 and 31 studies respectively, with both charts showing an overall balance of evidence for oxidative stress. Charts C and D, relate to heat shock proteins “HSP Studies”, involve 28 and 7 studies, showing variable effects. Charts E and F display spindle disturbance studies, both with 10 and 2 studies, all showing 100 percent statistically significant effects. Segments of each donut present the proportion of studies both as a percentage and number of studies by study type: epidemiological (purple), in vitro (orange), and in vivo (green) studies with statistically significant effects marked in orange and no effects in gray.
Figure 10
Results for potential biological mechanisms of DNA damage: (A, B) free radicals/oxidative stress, (C, D) heat shock protein expression/levels and (E, F) spindle disturbances.
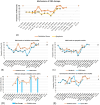
Five line graphs detailing mechanisms of DNA damage across exposure time frames. (A) Depicts the proportion of oxidative stress and apoptosis studies finding statistically significant effects over time. (B) Compares DNA breaks and oxidative stress. (C) Compares DNA breaks and apoptosis. (D) Shows DNA base damage versus oxidative stress as a line and bar chart. (E) Compares chromosome aberrations with oxidative stress. Each graph uses distinct color lines for each endpoint and overlays the number of studies finding effects over time intervals labeled A (< 1min exposures) to S (> 1 year exposures).
Figure 11
(A) Proportion of mechanisms showing damage vs. exposure time intervals (the numbers of studies showing effects are shown on the line); (B–E) Correspondence between patterns of evidence for mechanisms and patterns of evidence for DNA damage types across exposure time intervals.
Diagram illustrating the impact of radiofrequency electromagnetic frequencies (RF-EMF) on cells. RF-EMF affects voltage-gated ion channels, leading to an increase in cytosolic calcium ion concentration. To restore ionic balance, cells actively transport calcium against its concentration gradient, a process that requires ATP. This increased energy demand alters cellular metabolism. RF-EMF may disrupt mitochondrial function and membrane potential. RF-EMF also facilitates Fenton reactions and together with altered metabolism can increase free radical production, leading to an oxidative stress state, lipid peroxidation, protein oxidation, and DNA damage, which are all markers of cellular stress. Cells attempt to restore homeostasis and repair damage by expressing genes that encode DNA repair proteins and antioxidant enzymes. Gene transcription and protein synthesis, can themselves indirectly generate additional free radicals as a byproduct of increased metabolic activity. Damage to DNA and other cellular components can lead to apoptosis, necrosis, premature aging. Additionally, diseases like cancer, neurodegeneration, and infertility, with possible cognitive function deficiencies have also been linked to accumulated DNA damage.
Figure 12
RF-EMF pathway for cellular and DNA damage.
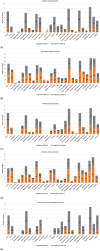
Five Bar charts compare DNA damage balance of evidence findings for each experimental parameters by main funding source. Chart (A) Industry, (C) Military and (E) Telecommunications Regulator funded studies show predominantly no effects while (B) government and (D) institution study parameters show more significant DNA damage effects. All bar charts use orange color for showing significant effects and gray for no significant effects. Experimental parameter categories include study type, exposure duration, intensity, signal characteristics, signal source and cell type.
Figure 13
Study Parameters and balance of evidence by primary funding source; (A) Industry funded, (B) Government funded, (C) Military funded, (D) Institution funded and (E) Telecom regulator funded.

Similar articles

References

    1. Stewart BW, Kleihues P. World Cancer Report 2003. Lyon: IARCPress; (2003).
    1. Boyle P, Levin B. World Cancer Report. Lyon: International Agency for Research on Cancer; (2008).
    1. Stewart B, Wild C. Wolrd Cancer Report. Geneva: WHO Press; (2014).
    1. Wild CP, Weiderpass E, Stewart BW (editors). World Cancer Report: Cancer Research for Cancer Prevention. Lyon: International Agency for Research on Cancer; (2020). - PubMed
    1. Gu YF, Lin FP, Epstein RJ. How aging of the global population is changing oncology. Ecancermedicalscience. (2021) 15:ed119. 10.3332/ecancer.2021.ed119 - DOI - PMC - PubMed

MeSH terms

LinkOut - more resources