SLC38A1 and STX11 are mitochondria-related biomarkers associated with immune infiltration in osteoarthritis
- PMID: 40809843
- PMCID: PMC12343263
- DOI: 10.3389/fgene.2025.1585775
SLC38A1 and STX11 are mitochondria-related biomarkers associated with immune infiltration in osteoarthritis
Abstract
Background: Mitochondrial dynamics and mitophagy play crucial roles in osteoarthritis (OA); however, the specific contributions of mitochondrial dynamics-related genes (MD-RGs) and mitophagy-related genes (MP-RGs) remain unclear. This study aimed to elucidate the precise mechanisms linking these genes in the context of OA.
Methods: OA-related transcriptome datasets and single-cell RNA sequencing (scRNA-seq) dataset incorporating MD-RGs and MP-RGs were utilized in this study. Hub genes were identified through differential expression analysis, weighted gene co-expression network analysis (WGCNA), and machine learning. A nomogram was then constructed based on the hub genes. Enrichment and immune infiltration analyses were performed on the hub genes, and key cell types were identified based on hub gene expression. Finally, the expression of the hub genes was validated using reverse transcription-quantitative polymerase chain reaction (RT-qPCR).
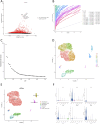
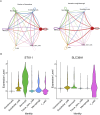
Results: SLC38A1 and STX11 were identified as hub genes linked to mitochondrial dynamics and mitophagy in OA. These genes enabled the construction of a reliable nomogram for predicting OA risk. Enrichment analysis revealed that the top biological processes converged on the ECM-receptor interaction, underscoring its critical role in OA pathogenesis. Immune infiltration analysis uncovered significant disparities in 10 immune cell types, including activated CD4 T cells and central memory CD4 T cells, between OA patients and healthy controls. The levels of these immune cells were strongly correlated with the expression of SLC38A1 and STX11. Additionally, endothelial cells, monocytes, and T cells emerged as key cellular players in OA. RT-qPCR validation showed that SLC38A1 was significantly downregulated in OA samples, and STX11 exhibited a similar trend, suggesting their potential roles in OA progression.
Conclusion: This study identified SLC38A1 and STX11 as key genes linked to mitochondrial dynamics and mitophagy in OA. These findings provide a theoretical basis and valuable reference for the diagnosis and treatment of OA.
Keywords: immune infiltration analysis; mitochondrial dynamics; mitophagy; osteoarthritis; single-cell analysis.
Copyright © 2025 Lv, Yu, Yan, Cai and Wang.
Conflict of interest statement
The authors declare that the research was conducted in the absence of any commercial or financial relationships that could be construed as a potential conflict of interest.
Figures


Similar articles
-
Identification of shared key genes and pathways in osteoarthritis and sarcopenia patients based on bioinformatics analysis.Zhong Nan Da Xue Xue Bao Yi Xue Ban. 2025 Mar 28;50(3):430-446. doi: 10.11817/j.issn.1672-7347.2025.240669. Zhong Nan Da Xue Xue Bao Yi Xue Ban. 2025. PMID: 40628511 Chinese, English.
-
Integrated multi-omics and machine learning reveals immune-metabolic signatures in osteoarthritis: from bulk RNA-seq to single-cell resolution.Front Immunol. 2025 Jun 16;16:1599930. doi: 10.3389/fimmu.2025.1599930. eCollection 2025. Front Immunol. 2025. PMID: 40589764 Free PMC article.
-
Integrated bioinformatics and network pharmacology to identify and validate macrophage polarization related hub genes in the treatment of osteoarthritis with Astragalus membranaceus.J Orthop Surg Res. 2025 May 30;20(1):543. doi: 10.1186/s13018-025-05799-9. J Orthop Surg Res. 2025. PMID: 40442788 Free PMC article.
-
Identification of Key Glycolysis-Related Genes in Osteoarthritis and Their Correlation with Immune Infiltration Using Bioinformatics Analysis and Machine Learning.Open Access Rheumatol. 2025 Aug 16;17:157-171. doi: 10.2147/OARRR.S541568. eCollection 2025. Open Access Rheumatol. 2025. PMID: 40842856 Free PMC article.
-
Hyaluronic acid and other conservative treatment options for osteoarthritis of the ankle.Cochrane Database Syst Rev. 2015 Oct 17;2015(10):CD010643. doi: 10.1002/14651858.CD010643.pub2. Cochrane Database Syst Rev. 2015. PMID: 26475434 Free PMC article.
References
-
- Abeni E., Cocola C., Croci S., Martino V., Piscitelli E., Gualtierotti R., et al. (2024). Single-cell transcriptomic analysis to identify endomembrane regulation of metalloproteins and motor proteins in autoimmunity. Adv. Protein Chem. Struct. Biol. 141, 299–329. 10.1016/bs.apcsb.2024.03.007 - DOI - PubMed
LinkOut - more resources
Full Text Sources
Research Materials

