. 2025 Jul 30:16:1578075.
doi: 10.3389/fgene.2025.1578075. eCollection 2025.

Identification and validation of ubiquitination-related genes for predicting cervical cancer outcome

Affiliations

Identification and validation of ubiquitination-related genes for predicting cervical cancer outcome

Ge Jin et al. Front Genet. .

Abstract

Introduction: Abnormalities in ubiquitination-related pathways or systems are closely associated with various cancers, including cervical cancer (CC). However, the biological function and clinical value of ubiquitination-related genes (UbLGs) in CC remain unclear. This study aimed to explore key UbLGs associated with CC, construct a prognostic model, and investigate their potential clinical and immunological significance.

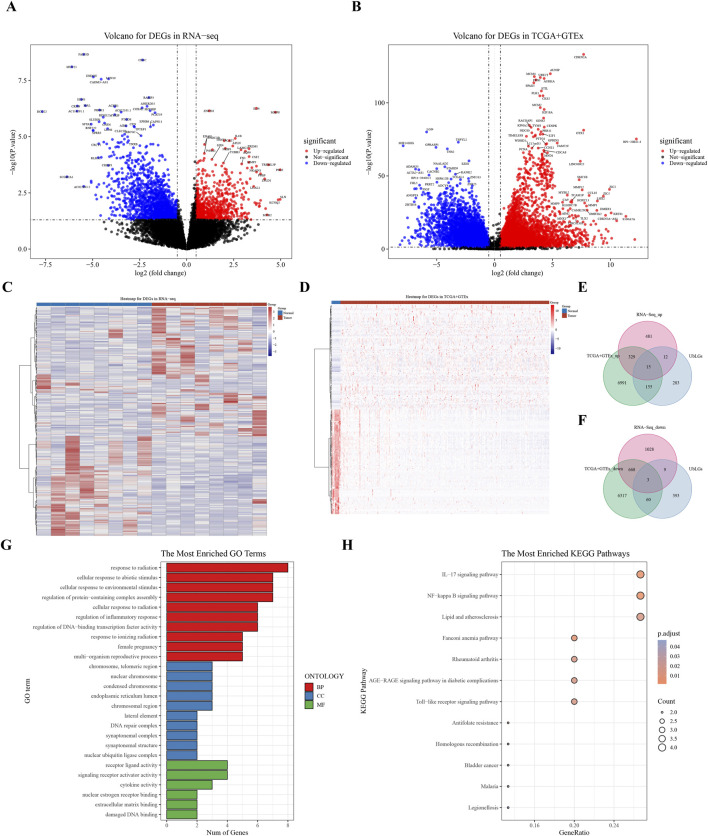
Methods: Differentially expressed genes (DEGs) between CC (tumor) and standard samples in self-sequencing and TCGA-GTEx-CESC datasets were identified using differential analysis. We identified overlaps between DEGs in both datasets and UbLGs, revealing key crossover genes. Subsequently, biological markers were identified via univariate Cox regression analysis and least absolute shrinkage and selection operator algorithms. After conducting independent prognostic analysis, immune infiltration analysis was performed to investigate the immune cells that differed between the two risk subgroups. Differences in immune checkpoint expression between the subgroups were analyzed. Real-Time Quantitative Polymerase Chain Reaction (RT-qPCR) was performed to confirm the expression trends of the biomarkers.

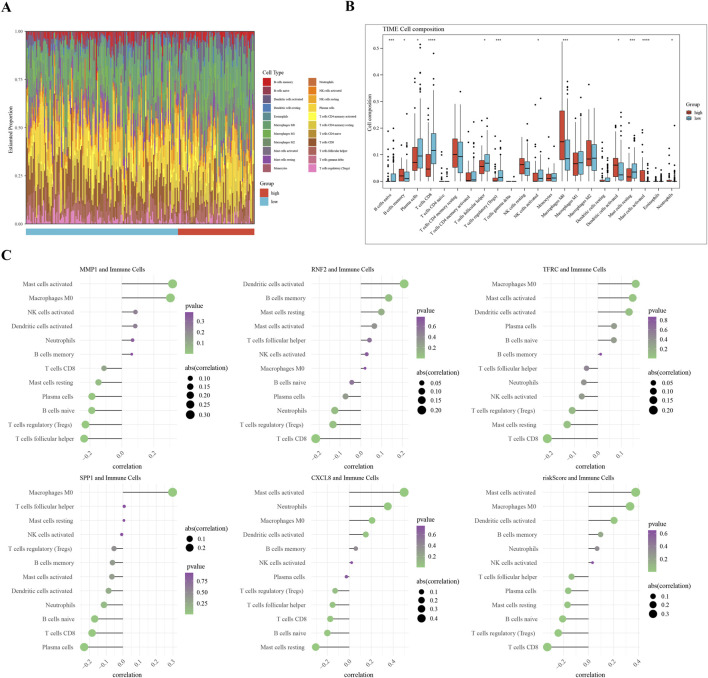
Results: Differentially expressed genes related to ubiquitination were screened from the Self-seq and TCGAGTEx-CESC datasets, and five key biomarkers (MMP1, RNF2, TFRC, SPP1, and CXCL8) were identified. The risk score model constructed based on these biomarkers could effectively predict the survival rate of cervical cancer patients (AUC >0.6 for 1/3/5 years). Immune microenvironment analysis showed that 12 types of immune cells, including memory B cells and M0 macrophages, as well as four immune checkpoints, exhibited significant differences between the high-risk and low-risk groups. RT-qPCR confirmed that MMP1, TFRC, and CXCL8 were upregulated in tumor tissues.

Discussion: Our study identified five ubiquitination-related biomarkers, namely, MMP1, RNF2, TFRC, SPP1, and CXCL8, which were significantly associated with CC. The validated risk model demonstrates strong predictive value for patient survival. These findings provide crucial insights into the role of ubiquitination in CC pathogenesis and offer valuable targets for advancing future research and therapeutic strategies.

Keywords: bioinformatics analysis; biomarker; cervical cancer; prognosis; ubiquitination.


Conflict of interest statement

The authors declare that the research was conducted in the absence of any commercial or financial relationships that could be construed as a potential conflict of interest.

Figures

FIGURE 1
FIGURE 1
Analysis of Differentially Expressed Genes (DEGs) in Cervical Cancer. (A) Volcano plot of DEGs derived from RNA sequencing data. (B) Volcano plot of DEGs from the combined TCGA and GTEx datasets. (C, D) Heat maps showing the expression profiles of identified DEGs. (E, F) Venn diagram representing the overlap of DEGs, highlighting 18 key crossover genes. (G, H) GO and KEGG pathway analysis of the crossover genes, providing insights into their biological functions and associated pathways.
FIGURE 2
FIGURE 2
Prognostic Biomarker Identification and Survival Analysis (A) Univariate Cox regression analysis identifying five significant biomarkers (MMP1, RNF2, TFRC, SPP1, CXCL8). (B) LASSO and Cox regression model for biomarker selection. (C) Distribution of cervical cancer samples into high-risk and low-risk groups based on biomarker expression levels. (D) Kaplan-Meier survival curves demonstrating survival differences between high-risk and low-risk groups. (E) Receiver Operating Characteristic (ROC) curves for 1-, 3-, and 5-year survival predictions, assessing the model’s predictive accuracy.
FIGURE 3
FIGURE 3
Model Validation Across Datasets (A–F) Consistency of the prognostic model’s performance in the testing set and the GSE52903 validation set, confirming the model’s reliability and generalizability.
FIGURE 4
FIGURE 4
Nomogram Development for Prognostic Prediction (A) Univariate Cox analysis identifying significant clinical factors including Risk Score, Stage, and Pathological T and N stages. (B) Figure of schoenfeld residual test (C) Risk Score confirmed as an independent prognostic factor. (D) Nomogram constructed based on the risk score to predict 1-, 3-, and 5-year survival rates for cervical cancer patients. (E) Calibration curves of nomogram. (F) The ROC curve of the nomogram.
FIGURE 5
FIGURE 5
Gene Set Enrichment Analysis (GSEA) in High- and Low-Risk Subgroups (A) GO term enrichment analysis revealing biological processes overrepresented in high- and low-risk subgroups. (B) KEGG pathway enrichment analysis highlighting signaling pathways differentially active between the two risk groups.
FIGURE 6
FIGURE 6
Immune Infiltration Analysis in Cervical Cancer Subgroups (A) Overview of differential immune cell populations between high-risk and low-risk subgroups. (B) Bar plot of twelve differentially abundant immune cells, showing fold change in abundance. (C) Visualization of Spearman’s correlation coefficients between risk scores and expression levels of differential immune cells, indicating the strength and significance of correlations.
FIGURE 7
FIGURE 7
Immune Checkpoint Expression and Anti-cancer Immune Response Analysis (A) Comparative analysis of immune checkpoint molecule expression levels (TIGIT, LAG-3, GAL9, PD-1) between high-risk and low-risk subgroups. (B) Spearman’s correlation analysis between risk scores and PD-1 expression levels. (C) Differential immune activity scores from the TIP tool, comparing the anti-cancer immune response in high-risk versus low-risk groups. (D) Box plot of drug sensitivity differences between high-risk and low-risk groups. ** represented P < 0.01, *** represented P < 0.001, **** represented P < 0.0001.
FIGURE 8
FIGURE 8
Box plot for expression validation of biomarkers (A) the TCGA-GTEx-CESC dataset. (B) GSE52903 dataset.
FIGURE 9
FIGURE 9
RT-qPCR Validation of Prognostic Biomarkers (A–E) Validation of biomarker expression (MMP1, TFRC, CXCL8) in cervical cancer tissues versus normal paracancerous tissues by RT-qPCR. Each panel displays relative expression levels, with sample types indicated on the x-axis and fold change in expression on the y-axis. Asterisks denote statistical significance levels, with ns indicating non-significance and *P < 0.05 indicating significant expression differences.

Similar articles

References

    1. Allemani C., Matsuda T., Di Carlo V., Harewood R., Matz M., Nikšić M., et al. (2018). Global surveillance of trends in cancer survival 2000-14 (CONCORD-3): analysis of individual records for 37 513 025 patients diagnosed with one of 18 cancers from 322 population-based registries in 71 countries. Lancet 391 (10125), 1023–1075. 10.1016/S0140-6736(17)33326-3 - DOI - PMC - PubMed
    1. An R., Cheng L., Chen L., Du J. (2018). Plk1 interacts with RNF2 and promotes its ubiquitin-dependent degradation. Oncol. Rep. 39 (5), 2358–2364. 10.3892/or.2018.6326 - DOI - PubMed
    1. Bălăşoiu M., Bălăşoiu A. T., Mogoantă S., Bărbălan A., Stepan A. E., Ciurea R. N., et al. (2014). Serum and tumor microenvironment IL-8 values in different stages of colorectal cancer. Rom. J. Morphol. Embryol. 55 (2 Suppl. l), 575–578. - PubMed
    1. Barter J. F., Soong S. J., Hatch K. D., Orr J. W., Shingleton H. M. (1990). Diagnosis and treatment of pulmonary metastases from cervical carcinoma. Gynecol. Oncol. 38 (3), 347–351. 10.1016/0090-8258(90)90071-r - DOI - PubMed
    1. Bray F., Ferlay J., Soerjomataram I., Siegel R. L., Torre L. A., Jemal A. (2018). Global cancer statistics 2018: GLOBOCAN estimates of incidence and mortality worldwide for 36 cancers in 185 countries. CA Cancer J. Clin. 68 (6), 394–424. 10.3322/caac.21492 - DOI - PubMed

LinkOut - more resources