

Traffic-Emitted Amines Promote New Particle Formation at Roadsides
- PMID: 40809915
- PMCID: PMC12340761
- DOI: 10.1021/acsestair.5c00119
Traffic-Emitted Amines Promote New Particle Formation at Roadsides
Abstract
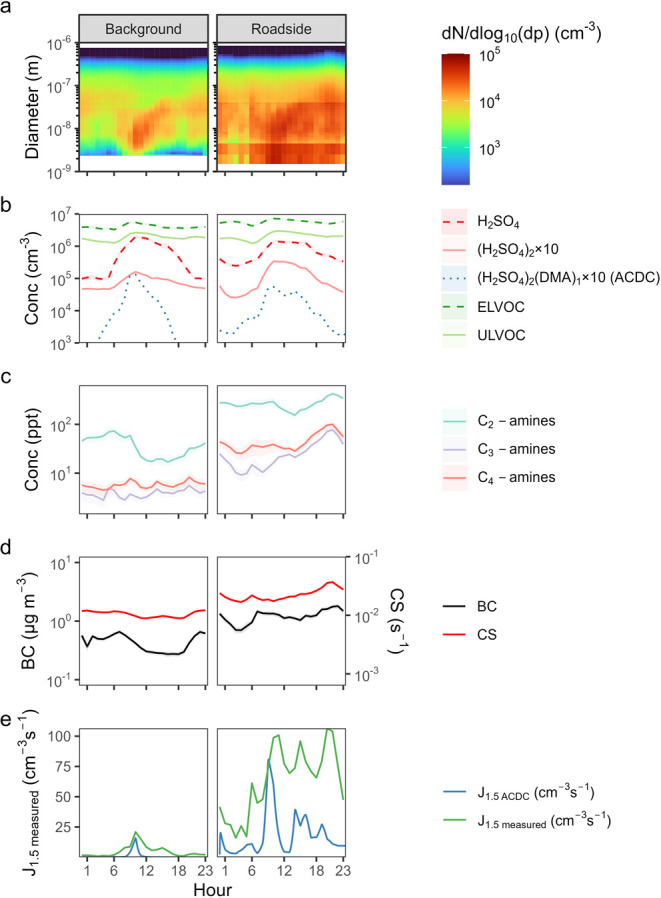
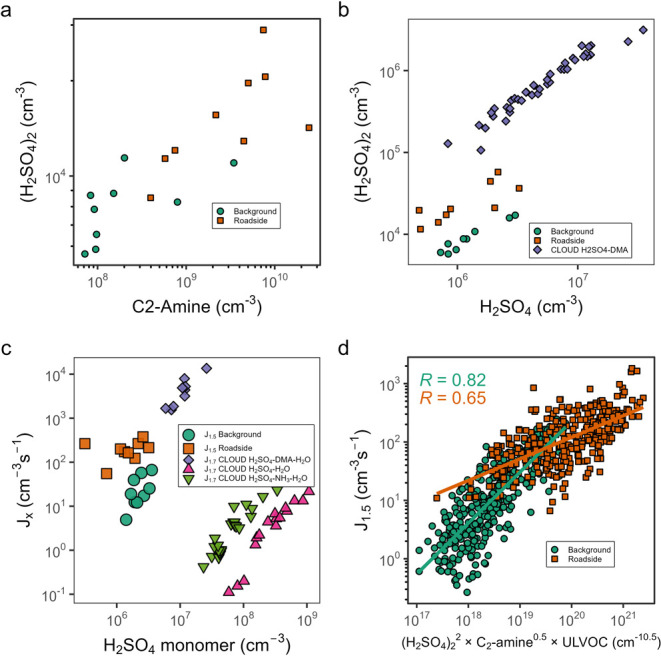
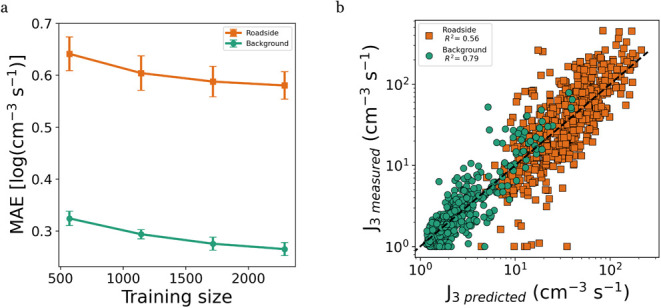
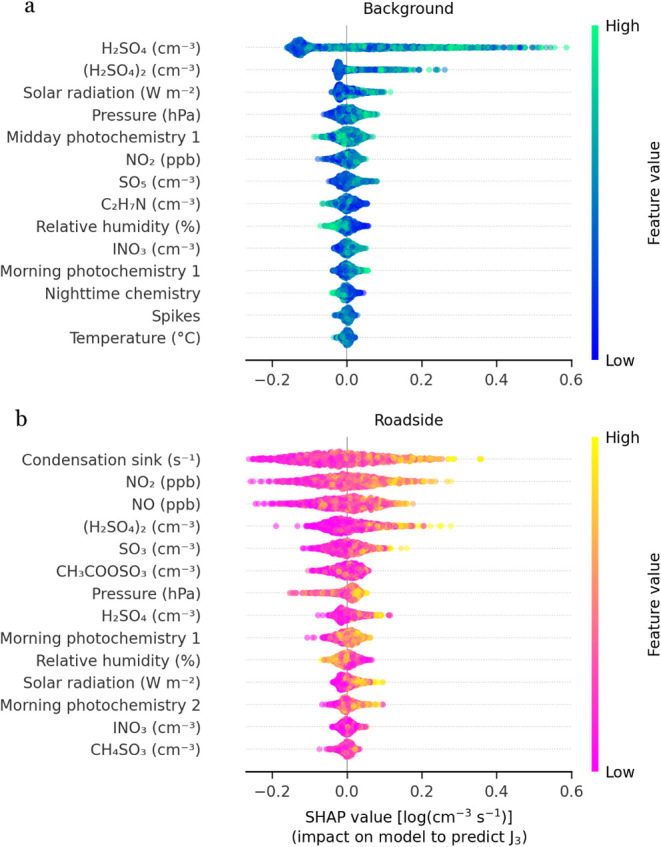
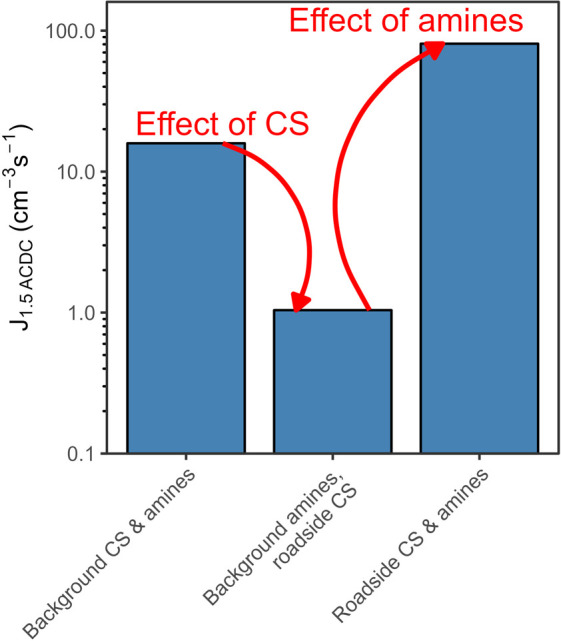
New particle formation (NPF) is a major source of atmospheric aerosol particles, significantly influencing particle number concentrations in urban environments. High condensation and coagulation sinks at highly trafficked roadside sites should suppress NPF due to the low survival probability of clusters and new particles, however, observations show that roadside NPF is frequent and intense. Here, we investigate NPF at an urban background and roadside site in Central Europe using simultaneous measurements of sulfuric acid, amines, highly oxygenated organic molecules (HOMs), and particle number size distributions. We demonstrate that sulfuric acid and amines, particularly traffic-derived C2-amines, are the primary participants in particle formation. C2-amine concentrations at the roadside are enhanced by over a factor of 4 relative to the background, overcoming the effect of enhanced coagulation and condensation sinks. Using machine learning we identify a further but uncertain enhancing role of HOMs. These findings reveal the critical role of traffic emissions in urban NPF.
Keywords: NPF; aerosol; nucleation; pollution; traffic.
© 2025 The Authors. Published by American Chemical Society.
Figures
Similar articles
-
Road Traffic Emissions Lead to Much Enhanced New Particle Formation through Increased Growth Rates.Environ Sci Technol. 2024 Jun 18;58(24):10664-10674. doi: 10.1021/acs.est.3c10526. Epub 2024 Jun 8. Environ Sci Technol. 2024. PMID: 38850427 Free PMC article.
-
Size- and Composition-Dependent Hygroscopic Growth of Sub-20 nm Atmospherically Relevant Particles: Implications for New Particle Survival.Environ Sci Technol. 2025 Jul 1;59(25):12786-12796. doi: 10.1021/acs.est.5c00068. Epub 2025 Jun 13. Environ Sci Technol. 2025. PMID: 40512596
-
Prescription of Controlled Substances: Benefits and Risks.2025 Jul 6. In: StatPearls [Internet]. Treasure Island (FL): StatPearls Publishing; 2025 Jan–. 2025 Jul 6. In: StatPearls [Internet]. Treasure Island (FL): StatPearls Publishing; 2025 Jan–. PMID: 30726003 Free Books & Documents.
-
Electronic cigarettes for smoking cessation and reduction.Cochrane Database Syst Rev. 2014;(12):CD010216. doi: 10.1002/14651858.CD010216.pub2. Epub 2014 Dec 17. Cochrane Database Syst Rev. 2014. PMID: 25515689
-
Systemic pharmacological treatments for chronic plaque psoriasis: a network meta-analysis.Cochrane Database Syst Rev. 2017 Dec 22;12(12):CD011535. doi: 10.1002/14651858.CD011535.pub2. Cochrane Database Syst Rev. 2017. Update in: Cochrane Database Syst Rev. 2020 Jan 9;1:CD011535. doi: 10.1002/14651858.CD011535.pub3. PMID: 29271481 Free PMC article. Updated.
References
-
- IPCC . Masson-Delmotte, V. ; Zhai, P. ; Pirani, A. ; et al. Climate Change 2021: The Physical Science Basis. Contribution of Working Group I to the Sixth Assessment Report of the Intergovernmental Panel on Climate Change; Cambridge University Press: Cambridge, U.K., and New York, 2021.
-
- Bousiotis D.. et al. A phenomenology of new particle formation (NPF) at 13 European sites. Atmos. Chem. Phys. 2021;21:11905–11925. doi: 10.5194/acp-21-11905-2021. - DOI
-
- Lee S. H.. et al. New Particle Formation in the Atmosphere: From Molecular Clusters to Global Climate. J. Geophys. Res.:Atmos. 2019;124:7098–7146. doi: 10.1029/2018JD029356. - DOI