. 2025 Jul 21;16(8):3295-3314.
doi: 10.1364/BOE.567345. eCollection 2025 Aug 1.

Simulation-based dosimetry of transcranial and intranasal photobiomodulation of the human brain: the roles of wavelength, power density, and skin tone

Affiliations

Simulation-based dosimetry of transcranial and intranasal photobiomodulation of the human brain: the roles of wavelength, power density, and skin tone

Hannah Van Lankveld et al. Biomed Opt Express. .

Abstract

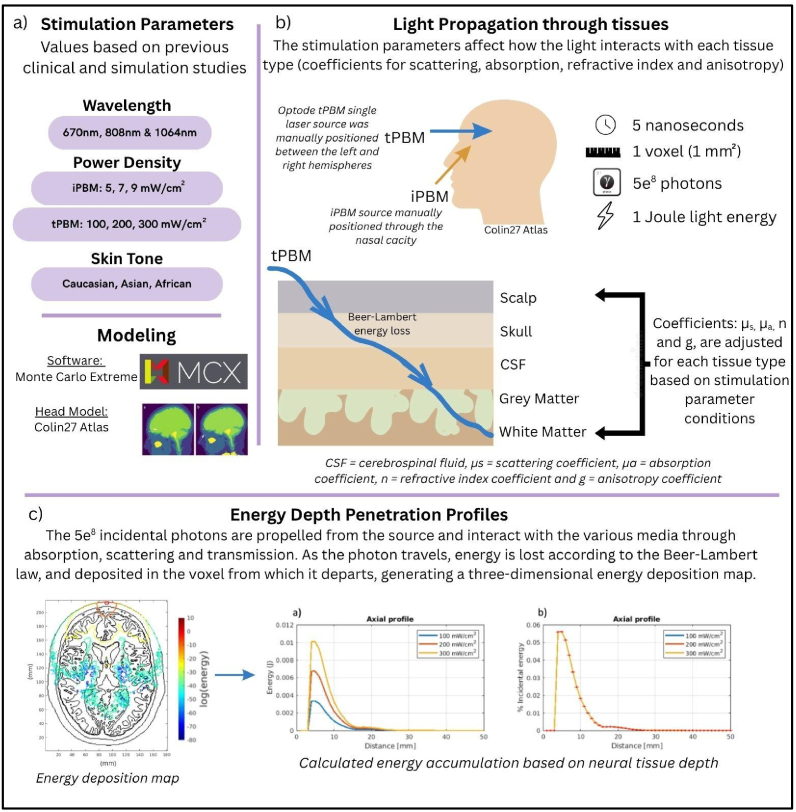
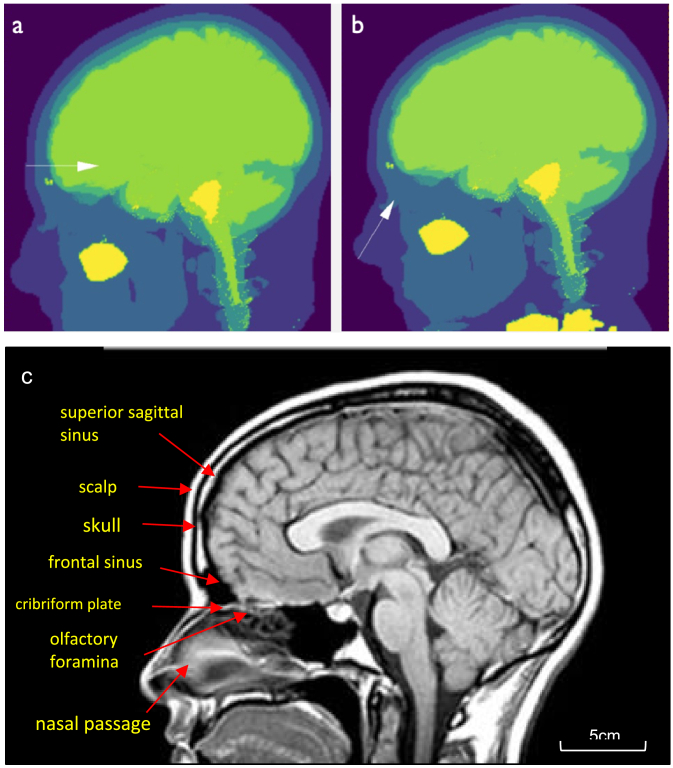
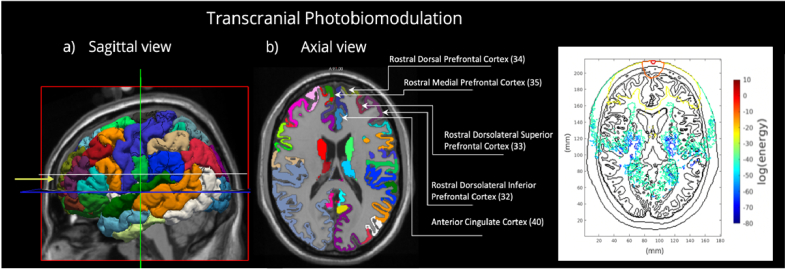
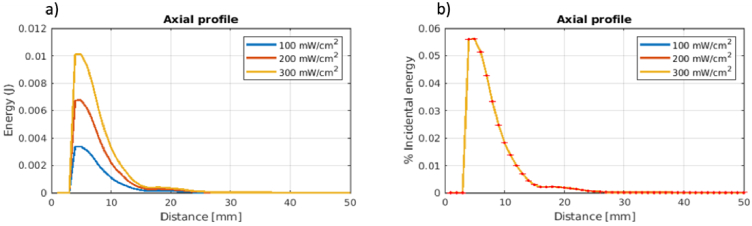
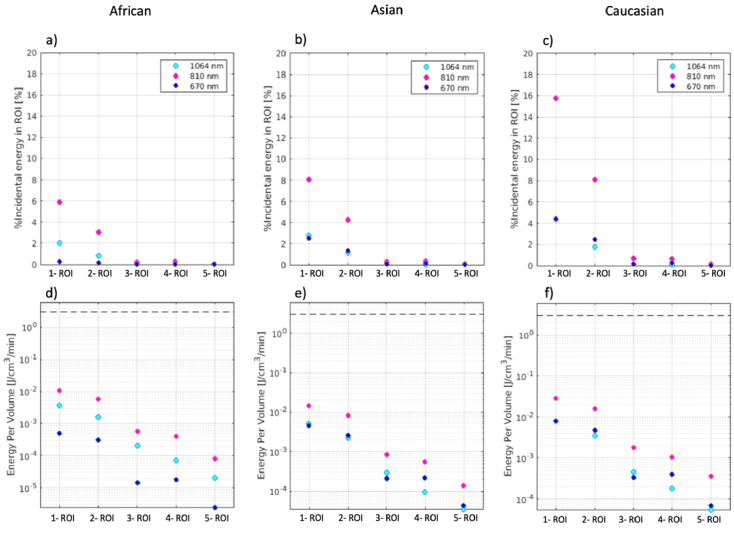
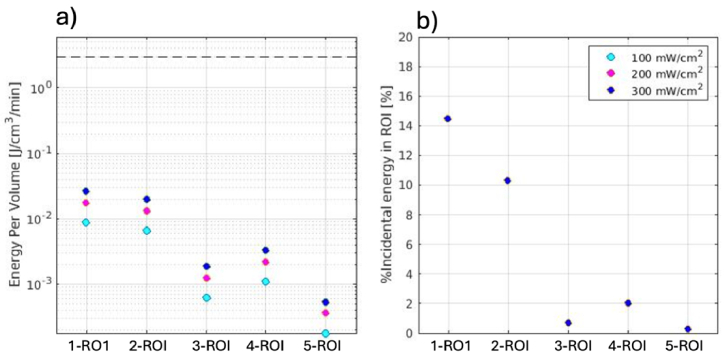
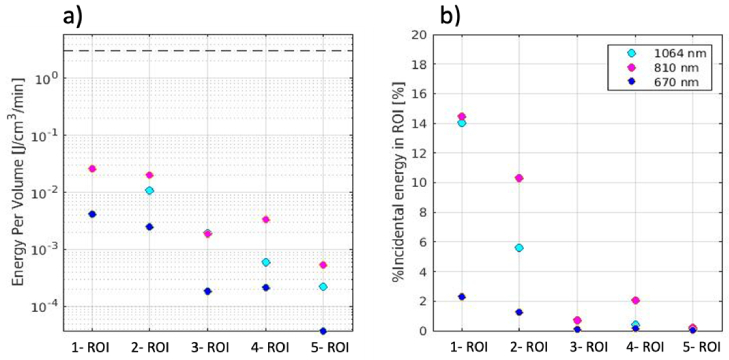
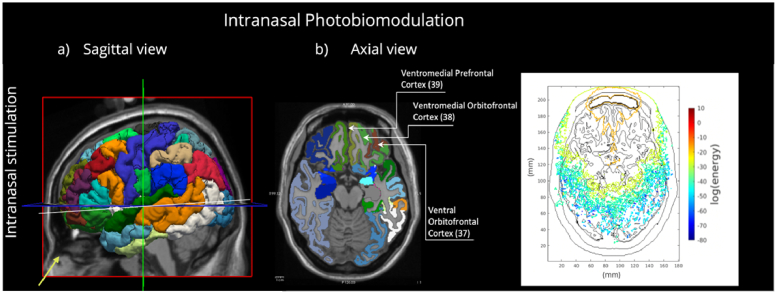
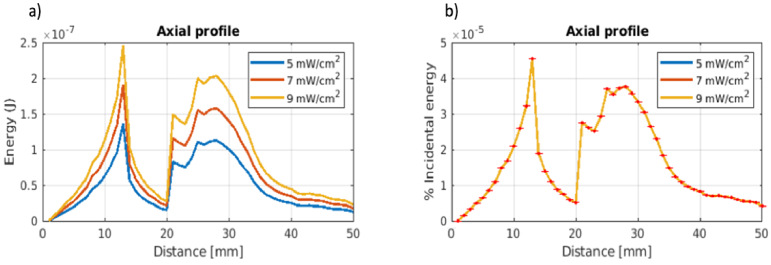
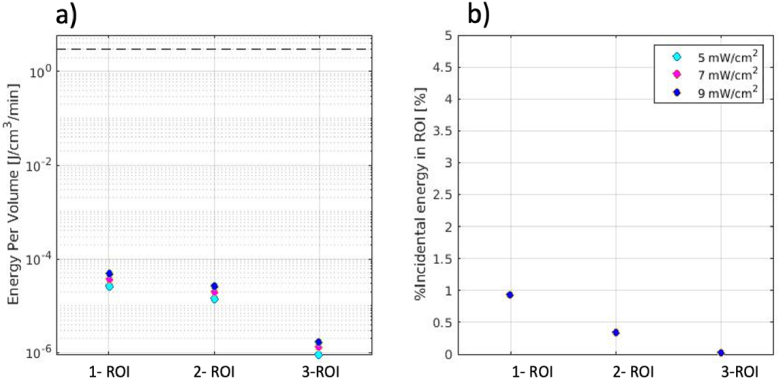
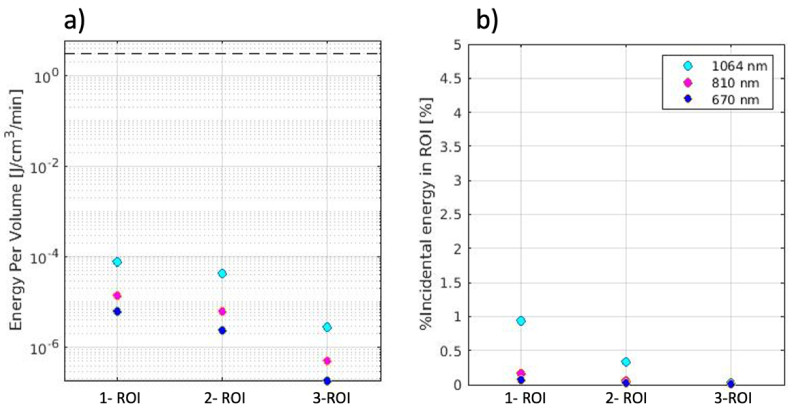
Photobiomodulation (PBM) using near-infrared (NIR) light is a novel neuromodulation technique. However, despite the many in vivo studies, the stimulation protocols for PBM vary across studies, and the current understanding of the physiological effects of PBM, as well as the dose dependence, is limited. Specifically, although NIR light can be absorbed by melanin in the skin, the understanding of how skin tones compare and how their influence interacts with other dose parameters remains limited. This study investigates the effect of melanin, optical power density, and wavelength on light penetration and energy accumulation via forehead and intranasal PBM. We use Monte Carlo simulations of a single laser source for transcranial (tPBM, forehead position) and intranasal (iPBM, nostril position) irradiation on a healthy human brain model. We investigate wavelengths of 670, 810, and 1064 nm at various power densities in combination with light ("Caucasian"), medium ("Asian"), and dark ("African") skin tone categories as defined in the literature. Our simulations show that a maximum of 15% of the incidental energy for tPBM and 1% for iPBM reaches the cortex from the light source. The rostral dorsal prefrontal cortex and the ventromedial prefrontal cortex accumulate the highest light energy in tPBM and iPBM, respectively, for both wavelengths. Notably, we show that nominally "Caucasian" skin allows the highest energy accumulation of all three skin tones. Moreover, the 810 nm wavelength for tPBM and the 1064 nm wavelength for iPBM produced the highest cortical energy accumulation, which was linearly correlated with optical power density, but these variations could be overridden by a difference in skin tone in the tPBM case.The simulations serve as a starting point for enabling hypothesis generation for in vivo PBM investigations. This study is the first to account for skin tone as a tPBM dosing consideration. For the future of PBM research, it is important to evaluate combinations of stimulation parameters (wavelength, optical power density, pulsation frequency, duration, light source) when working to determine an optimal dosage for PBM-based therapy.


Conflict of interest statement

Lew Lim is the CRO and the shareholder of Vielight Inc. Nazanin Hosseinkhah is the director of special projects of Vielight Inc. Paolo Cassano is the Cofounder, chair of scientific advisory board, board member and stock owner of Niraxx Inc.

Figures

Fig. 1.
Fig. 1.
Overview of the simulation process experimental design (a) inputted simulation parameters, selected modelling software and atlas. b) optode source positioning indication and direction through the multi-layer tissue. c) monte carlo energy deposition map output and subsequent energy (J) percentages.
Fig. 2.
Fig. 2.
Sagittal slice optode positioning for (a) tPBM and (b) iPBM settings overlayed onto the Colin27 head atlas. The arrow indicates the position and direction of the flow of photons. Figure 2(c) highlights the anatomical regions of the brain that both tPBM and iPBM incoming photons must penetrate, as well as the tissue types included in the simulations.
Fig. 3.
Fig. 3.
Transcranial PBM irradiation configuration and key regions of interest (ROIs). The yellow arrow represents the laser location, and the white line indicates the axial slice location. The sagittal and axial views of the cortical parcellations are shown in (a) and (b), respectively. The regions receiving the highest energy deposition according to the profile are labelled. The codes correspond to the colour codes used to identify these brain regions in the atlas. Moreover, a sample axial view of the energy deposition profile is shown in the right bottom corner, in which the axes represent the voxel dimensions, and the colour scale represents the log of energy levels.
Fig. 4.
Fig. 4.
Energy depth penetration profiles for transcranial PBM (tPBM) as a function of power density. In this plot, a wavelength of 810 nm and the MCX software’s default scalp parameters are assumed. a) The light penetration profile is shown as a function of increasing distance from the light source. Energy (Joules) shown on the y axis for each of the three optical power densities, and light penetration depth on the x axis, where a distance of zero is defined as the position of the tail end of the arrow shown in Fig. 2. b) Percent incidental energy accumulated at the specified penetration depth. Error bars are representative of the standard deviation across the 10 Monte Carlo simulations.
Fig. 5.
Fig. 5.
Energy accumulation in key ROIs for tPBM as a function of wavelength and skin tone type, assuming wavelengths of 670 nm, 810 nm, and 1064 nm, and an optical power density of 100 mW/cm2. (a-c) The percentage of incidental energy accumulated in each region of interest. The total energy in each region of interest after 1 minute of stimulation (plotted on log scale). (d-f) The total energy in each region of interest after 1 minute of stimulation (plotted on log scale) Note: 1-ROI: Rostral Dorsal Prefrontal, 2-ROI: Rostromedial Prefrontal, 3- ROI: Rostral Dorsolateral Superior Prefrontal, 4-ROI: Anterior Cingulate, 5 -ROI: Rostral Dorsolateral Inferior Prefrontal.
Fig. 6.
Fig. 6.
Optical power Plot energy accumulation of transcranial PBM (tPBM) as a function of power density (OPd) assuming a wavelength of 810 nm wavelength and the MCX software’s default scalp parameters. a) The total energy in each region of interest (ROI) after 1 minute of irradiation (plotted on log scale). b) The percent of incidental energy accumulated in each ROI, where all three power levels coincide. Note: 1-ROI: Rostral Dorsal Prefrontal, 2-ROI: Rostromedial Prefrontal, 3- ROI: Rostral Dorsolateral Superior Prefrontal, 4-ROI: Anterior Cingulate, 5 -ROI: Rostral Dorsolateral Inferior Prefrontal.
Fig. 7.
Fig. 7.
Energy accumulation over key ROIs for transcranial PBM (tPBM) as a function of wavelength, assuming a power density of 100 mW/cm2 and MCX software’s default scalp parameters. a) total energy in each region of interest after 1 minute of stimulation (plotted in log scale). b) The percentage of incidental energy accumulated in each region of interest. In both (a) and (b) 1064 nm percent incidental energy is shown in light blue, which is overlapped by the purple 670 nm, in regions of interest (a) 3 and 5 and (b) 1 and 3. Note: 1-ROI: Rostral Dorsal Prefrontal, 2-ROI: Rostromedial Prefrontal, 3- ROI: Rostral Dorsolateral Superior Prefrontal, 4-ROI: Anterior Cingulate, 5 -ROI: Rostral Dorsolateral Inferior Prefrontal.
Fig. 8.
Fig. 8.
Nasal irradiation configuration and key ROIs. The yellow arrow represents the laser location, and the white line indicates the axial slice location. The sagittal and axial views of the cortical parcellations are shown in (a) and (b), respectively. The regions receiving the highest energy deposition according to the profile are labelled. The codes correspond to the colour codes used to identify these brain regions in the atlas. Moreover, a sample axial view of the energy deposition profile is shown in the right bottom corner, in which the axes represent the voxel dimensions, and the colour scale represents the log of energy levels.
Fig. 9.
Fig. 9.
Energy depth penetration profiles for intranasal PBM (iPBM) as a function of power density. Varied optical power densities at 810 nm wavelength. a) Light penetration profile as a function of distance from the light source. b) Percent incidental energy accumulated at the specified penetration depth. Error bars represent 1 standard deviation across the 10 Monte Carlo iterations.
Fig. 10.
Fig. 10.
Energy accumulation over key ROIs for transcranial PBM (tPBM) as a function of power density, assuming an 810 nm wavelength and MCX software’s default scalp parameters. a) total energy in each region of interest after 1 minute of stimulation (plotted in log scale). b) percent incidental energy accumulated in each region of interest, where all three power levels coincide. Note: 1 - ROI: Ventromedial Prefrontal, 2 - ROI: Ventromedial Orbitofrontal and 3 - ROI: Ventral Orbitofrontal.
Fig. 11.
Fig. 11.
Energy accumulation over key ROIs for transcranial PBM (tPBM) as a function of wavelength., assuming a 5 mW/cm2 optical power density and MCX software’s default scalp parameters. a) Total energy in each region of interest after 1 minute of stimulation (plotted on a log scale). b) The percent of incidental energy accumulated in each region of interest. Note: 1 - ROI: Ventromedial Prefrontal, 2 - ROI: Ventromedial Orbitofrontal and 3 - ROI: Ventral Orbitofrontal.

Similar articles

References

    1. Zhang Q., Ma H., Nioka S., et al. , “Study of near infrared technology for intracranial hematoma detection,” J. Biomed. Opt. 5(2), 206–213 (2000). 10.1117/1.429988 - DOI - PubMed
    1. Hamblin M., “Shining light on the head: Photobiomodulation for brain disorders,” BBA Clin. 6, 113–124 (2016). 10.1016/j.bbacli.2016.09.002 - DOI - PMC - PubMed
    1. Wurtman R. J., “The Effects of Light on the Human Body,” Sci. Am. 233(1), 68–79 (1975).https://www.jstor.org/stable/24949844 - PubMed
    1. Thunshelle C., Hamblin M., “Transcranial Low-Level Laser (Light) Therapy for Brain Injury,” Photomed. Laser Surg. 34(12), 587–598 (2016). 10.1089/pho.2015.4051 - DOI - PMC - PubMed
    1. Collman J., “Interaction of nitric oxide with a functional model of cytochrome c oxidase,” Proc. Natl. Acad. Sci. U.S.A. 105(29), 9892–9896 (2008). 10.1073/pnas.0804257105 - DOI - PMC - PubMed

LinkOut - more resources