. 2025 Jul 15;16(8):3156-3171.
doi: 10.1364/BOE.565065. eCollection 2025 Aug 1.

In vivo dynamic imaging reveals the oviduct as a leaky peristaltic pump in transporting a preimplantation embryo toward pregnancy

Affiliations

In vivo dynamic imaging reveals the oviduct as a leaky peristaltic pump in transporting a preimplantation embryo toward pregnancy

Huan Han et al. Biomed Opt Express. .

Abstract

The mammalian oviduct (also called the fallopian tube) is an essential organ for natural pregnancy. As one of its major functions, the oviduct transports preimplantation embryos to the uterus for implantation. This is a critical process, and abnormalities are responsible for a range of reproductive disorders, such as tubal ectopic pregnancy and infertility, whose etiologies are unclear. For transporting embryos, the oviduct is fundamentally a tubular mechanical pump with motile cilia lining the luminal epithelium and smooth muscle surrounding the mucosa wall. Although bidirectional movement of embryos has been observed during the transport process, how the oviduct produces this type of embryo movement remains unknown. Understanding this pumping mechanism is vital to identifying the functional causes of oviduct-related reproductive disorders, but answering this question requires dynamic imaging of the transport process in its native environment, which is difficult to achieve in mammalian models. Here, we use optical coherence tomography and apply in vivo dynamic 3D imaging of the mouse oviduct to uncover the oviduct pumping mechanism in transporting preimplantation embryos toward pregnancy. By inhibiting the oviduct smooth muscle contraction, we first show that the oviduct muscular activity drives the bidirectional embryo movement. We then present a quantitative assessment of the oviduct contraction wave. This analysis, together with the embryo movement information, indicates that the forward movement of embryos is produced by peristalsis, while the backward embryo movement is generated by a suction process driven by the oviduct relaxation at earlier contraction sites, showing a leaky peristaltic pump. Finally, we reveal how the net displacement of embryos is created under this pumping mechanism, which effectively transports embryos toward the uterus. This work elucidates, for the first time, the oviduct pumping mechanism in transporting preimplantation embryos, paving the way for understanding the biomechanics of the mammalian oviduct.


Conflict of interest statement

The authors declare no conflicts of interest.

Figures
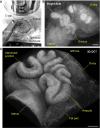
Fig. 1.
Fig. 1.
In vivo 3D imaging of the mouse oviduct using OCT through an intravital window. (A) In vivo imaging setup with a clamp stabilizing the intravital window implanted on the right dorsal side of the mouse. (B) In vivo bright-field image of the oviduct as well as the ovary and a portion of the uterus through the intravital window. (C) In vivo 3D OCT image of the oviduct through the intravital window showing its 3D morphology and structure. Scale bars are 500 µm.
Fig. 2.
Fig. 2.
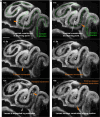
In vivo 3D OCT imaging of the preimplantation embryo movement and the oviduct contraction and relaxation. The embryo movement is bidirectional in all regions of the oviduct isthmus and coincides with the oviduct muscular activity shown as contraction and relaxation ( Visualization 1). Triangles of the same color point at the same embryo at different time points. Scale bar is 300 µm.
Fig. 3.
Fig. 3.
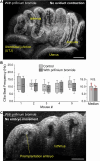
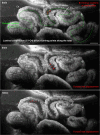
The movement of preimplantation embryos in the oviduct isthmus is driven by the oviduct muscular activity. (A) No oviduct contraction in vivo after topical administration of prifinium bromide to the oviduct, inhibiting the oviduct muscular activity ( Visualization 2). (B) The oviduct motile cilia remain beating at the similar rates in vivo after topical administration of prifinium bromide to the oviduct. Box plots with square dots for the mean and whiskers for the standard deviation. Bar plot shows the mean and standard deviation with data points representing the median value from each mouse. N.S. indicates not significant with p = 0.125 from Wilcoxon signed-rank test. Legend and vertical axis label apply to both box and bar plots. (C) There is no movement of preimplantation embryos in vivo after topical administration of prifinium bromide to the oviduct ( Visualization 3). Scale bars are 400 µm in (A) and 200 µm in (C).
Fig. 4.
Fig. 4.
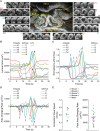
In vivo 3D dynamic imaging and quantitative assessment of the oviduct contraction wave propagation from the ampulla to the isthmus. (A) Cross-sectional images from selected locations of the ampulla, isthmus, and uterotubal junction (UTJ) showing the contraction process over time at different locations along the oviduct ( Visualization 4). (B) Plot of the luminal areas over time from all the locations in the ampulla, isthmus, and UTJ. Arrows point at the luminal expansion without a prior contraction. (C) Plot of the normalized luminal areas over time from the locations in the ampulla and isthmus. The normalization is for the curves to start around zero and have the minimum at negative one. Color arrows point at the luminal expansion right before contractions. Such luminal expansions do not exist at the contraction initiation sites. (D) Plot of the luminal area changing rate from the locations in the ampulla and isthmus. Color arrows point at the peak of changing rates during contractions. Locations I5 and UTJ are not included in (C) and (D) due to no contractions. (E) Measurements of the oviduct contraction wave propagation speed and the peak luminal area changing rate from four mice. The data points for each mouse represent different measurement locations on the oviduct. Scale bar is 300 µm, and all the cross-sectional timelapse images of the oviduct lumen share the same sale as the center image in (A).
Fig. 5.
Fig. 5.
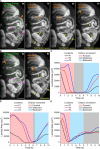
The forward embryo movement is driven by the oviduct contraction wave, while the backward movement of embryos is driven by the oviduct relaxation ( Visualization 5). (A) Images of the oviduct contraction wave propagation and the forward embryo movement show a peristaltic pumping process. (B) Images of the oviduct relaxation and the backward movement of embryos show a suction process, indicating a leaky peristaltic pump. Triangles point at the embryo location, and arrows show contraction or relaxation. (C) Plot of the luminal areas over time at three locations (P1–P3) overlapping with the embryo movement direction for data in (A) and (B). (D, E) Plots of the luminal areas over time together with embryo movement direction from two additional mice showing the leaky peristaltic pump. Scale bars are 400 µm.
Fig. 6.
Fig. 6.
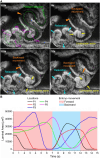
The backward embryo movement driven by the relaxation of the oviduct at earlier contraction sites can take place while the contraction wave propagation continues right in front of the moving embryos in the backward direction. (A) Images of the backward embryo movement with the oviduct relaxation from earlier contraction sites while the contraction wave continues propagating against the embryo movement ( Visualization 6). Triangles point at the embryo locations, yellow arrows show the contraction wave, and cyan arrows show the relaxation. (B) Plot of the luminal areas over time from locations P1–P5 in (A) overlapping with the embryo movement direction. Scale bar is 300 µm.
Fig. 7.
Fig. 7.
Dynamics of the luminal constriction at an oviduct turning point during the forward and backward movements of preimplantation embryos ( Visualization 7). (A) In the forward embryo movement driven by peristalsis, the constricted lumen at the turning point is expanded, allowing the embryo to easily pass through. (B) In the backward embryo movement driven by a suction process, the constricted lumen at the turning point remains constricted and can stop the embryo from moving through. Triangles point at the embryo locations. Scale bars are 300 µm.
Fig. 8.
Fig. 8.
The net displacement of embryos in the forward direction over time. Images of the preimplantation embryos (labeled as red spheres) and the luminal constrictions (C1–C4) at the oviduct turning points showing the net forward displacement of embryos relative to the turning points over 10 minutes. Scale bar is 300 µm.

Similar articles

  • Prescription of Controlled Substances: Benefits and Risks.
    Preuss CV, Kalava A, King KC. Preuss CV, et al. 2025 Jul 6. In: StatPearls [Internet]. Treasure Island (FL): StatPearls Publishing; 2025 Jan–. 2025 Jul 6. In: StatPearls [Internet]. Treasure Island (FL): StatPearls Publishing; 2025 Jan–. PMID: 30726003 Free Books & Documents.
  • Short-Term Memory Impairment.
    Cascella M, Al Khalili Y. Cascella M, et al. 2024 Jun 8. In: StatPearls [Internet]. Treasure Island (FL): StatPearls Publishing; 2025 Jan–. 2024 Jun 8. In: StatPearls [Internet]. Treasure Island (FL): StatPearls Publishing; 2025 Jan–. PMID: 31424720 Free Books & Documents.
  • Region-specific roles of oviductal motile cilia in oocyte/embryo transport and fertility†.
    Scully DM, Xia T, Musina GR, McCown MA, Umezu K, Kircher BK, Behringer RR, Larina IV. Scully DM, et al. Biol Reprod. 2025 Apr 13;112(4):651-662. doi: 10.1093/biolre/ioaf005. Biol Reprod. 2025. PMID: 39761349
  • Management of urinary stones by experts in stone disease (ESD 2025).
    Papatsoris A, Geavlete B, Radavoi GD, Alameedee M, Almusafer M, Ather MH, Budia A, Cumpanas AA, Kiremi MC, Dellis A, Elhowairis M, Galán-Llopis JA, Geavlete P, Guimerà Garcia J, Isern B, Jinga V, Lopez JM, Mainez JA, Mitsogiannis I, Mora Christian J, Moussa M, Multescu R, Oguz Acar Y, Petkova K, Piñero A, Popov E, Ramos Cebrian M, Rascu S, Siener R, Sountoulides P, Stamatelou K, Syed J, Trinchieri A. Papatsoris A, et al. Arch Ital Urol Androl. 2025 Jun 30;97(2):14085. doi: 10.4081/aiua.2025.14085. Epub 2025 Jun 30. Arch Ital Urol Androl. 2025. PMID: 40583613 Review.
  • Clinical outcomes following selection of human preimplantation embryos with time-lapse monitoring: a systematic review.
    Kaser DJ, Racowsky C. Kaser DJ, et al. Hum Reprod Update. 2014 Sep-Oct;20(5):617-31. doi: 10.1093/humupd/dmu023. Epub 2014 Jun 2. Hum Reprod Update. 2014. PMID: 24890606

References

    1. Avilés M., Coy P., Rizos D., “The oviduct: A key organ for the success of early reproductive events,” Animal Frontiers 5(1), 25–31 (2015). 10.2527/af.2015-0005 - DOI
    1. Li S., Winuthayanon W., “Oviduct: roles in fertilization and early embryo development,” J. Endocrinol. 232(1), R1–R26 (2017). 10.1530/JOE-16-0302 - DOI - PubMed
    1. Pérez-Cerezales S., Ramos-Ibeas P., Acuña O. S., et al. , “The oviduct: from sperm selection to the epigenetic landscape of the embryo†,” Biol. Reprod. 98(3), 262–276 (2018). 10.1093/biolre/iox173 - DOI - PubMed
    1. Croxatto H. B., “Physiology of gamete and embryo transport through the Fallopian tube*,” Reprod. BioMed. Online 4(2), 160–169 (2002). 10.1016/S1472-6483(10)61935-9 - DOI - PubMed
    1. Shaw J. L. V., Dey S. K., Critchley H. O. D., et al. , “Current knowledge of the aetiology of human tubal ectopic pregnancy,” Hum. Reprod. Update 16(4), 432–444 (2010). 10.1093/humupd/dmp057 - DOI - PMC - PubMed

LinkOut - more resources