

Optoretinography with actively stabilized adaptive optics optical coherence tomography
- PMID: 40809971
- PMCID: PMC12339298
- DOI: 10.1364/BOE.566376
Optoretinography with actively stabilized adaptive optics optical coherence tomography
Abstract
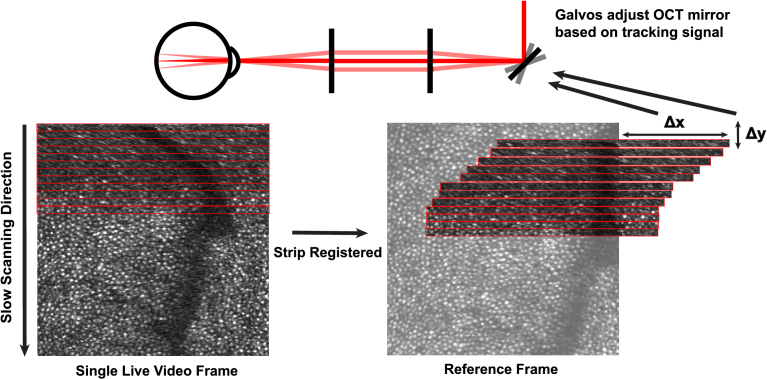
Optoretinography (ORG) is the optical measurement of changes in the retina in response to light stimulation. Adaptive optics optical coherence tomography (AOOCT) records photoreceptor ORGs by measuring the physical changes in their outer segment lengths in response to light stimulation. The main difficulty in recording these nanometer-scale changes is constant eye motion. Typically, fast volume acquisitions are used with offline spatial registration to compensate for the effect of eye motion. Here, we present an alternate solution whereby an adaptive optics scanning light ophthalmoscope (AOSLO) is used to measure the eye motion and actively guide the AOOCT beam to compensate for eye motion in real time. This system's cellular-scale tracking offers unparalleled control over scanning raster size and shape, allowing for high-speed (up to 100 kHz) ORG acquisition from targeted locations. We validate the method by comparing cone classifications against those made with an established ORG approach.
© 2025 Optica Publishing Group.
Conflict of interest statement
The authors have no financial disclosures that are relevant to this work. Feroldi is currently employed at Carl Zeiss Meditec. Hosseinaee is currently employed at Kodiak Sciences.
Figures


Similar articles
-
Multimodal High-Resolution Imaging in Retinitis Pigmentosa: A Comparison Between Optoretinography, Cone Density, and Visual Sensitivity.Invest Ophthalmol Vis Sci. 2024 Aug 1;65(10):45. doi: 10.1167/iovs.65.10.45. Invest Ophthalmol Vis Sci. 2024. PMID: 39207297 Free PMC article.
-
Prescription of Controlled Substances: Benefits and Risks.2025 Jul 6. In: StatPearls [Internet]. Treasure Island (FL): StatPearls Publishing; 2025 Jan–. 2025 Jul 6. In: StatPearls [Internet]. Treasure Island (FL): StatPearls Publishing; 2025 Jan–. PMID: 30726003 Free Books & Documents.
-
Foveal Retinal Ganglion Cells Develop Altered Calcium Dynamics Weeks After Photoreceptor Ablation.Ophthalmol Sci. 2024 Mar 22;4(5):100520. doi: 10.1016/j.xops.2024.100520. eCollection 2024 Sep-Oct. Ophthalmol Sci. 2024. PMID: 38881601 Free PMC article.
-
Optical coherence tomography (OCT) for detection of macular oedema in patients with diabetic retinopathy.Cochrane Database Syst Rev. 2015 Jan 7;1(1):CD008081. doi: 10.1002/14651858.CD008081.pub3. Cochrane Database Syst Rev. 2015. PMID: 25564068 Free PMC article.
-
Carbon dioxide detection for diagnosis of inadvertent respiratory tract placement of enterogastric tubes in children.Cochrane Database Syst Rev. 2025 Feb 19;2(2):CD011196. doi: 10.1002/14651858.CD011196.pub2. Cochrane Database Syst Rev. 2025. PMID: 39968844
References
Associated data
LinkOut - more resources
Full Text Sources