. 2025 Jul 22;16(8):3315-3336.
doi: 10.1364/BOE.563643. eCollection 2025 Aug 1.

Learning-enhanced 3D fiber orientation mapping in thick cardiac tissues

Affiliations

Learning-enhanced 3D fiber orientation mapping in thick cardiac tissues

Eda Nur Saruhan et al. Biomed Opt Express. .

Abstract

Fibrous proteins, such as elastin and collagen, are crucial for the structural integrity of the cardiovascular system. For thin tissue-engineered heart valves and surgical patches, the two-dimensional mapping of fiber orientation is well-established. However, for three-dimensional (3D) thick tissue samples, e.g., the embryonic whole heart, robust 3D fiber analysis tools are not available. This information is essential for computational vascular modeling and tissue microstructure characterization. Therefore, this study employs machine learning (ML) and deep learning (DL) techniques to analyze the 3D cardiovascular fiber structures in thick samples of porcine pericardium and embryonic whole hearts. It is hypothesized that ML/DL-based fiber orientation analysis will outperform traditional Fourier transform and directional filter methods by offering higher spatial accuracy and reduced dependency on manual preprocessing. We trained our ML/DL models on both synthetic and real-world cardiovascular datasets obtained from confocal imaging. The evaluation used a mixed dataset of 1200 samples and a porcine/bovine dataset of 400 samples. Support vector regression (SVR) demonstrated the highest accuracy, achieving a normalized mean absolute error (nMAE) of 5.0% on the mixed dataset and 13.0% on the biological dataset. Among DL models, convolutional neural network (CNN) and residual network-50 (ResNet50) had an nMAE of 12.0% and 11.0% on the mixed dataset and 23.0% and 22.0% on the biological dataset, respectively. Attention mechanisms improved performance further, with the channel attention ResNet50 achieving an nMAE of 5.8% on the mixed dataset and 21.0% on the biological dataset. These findings highlight the potential of ML and DL techniques in improving 3D fiber orientation detection, enabling detailed cardiovascular microstructural assessment.


Conflict of interest statement

The authors declare no conflicts of interest.

Figures

Fig. 1.
Fig. 1.
Cartoon representation of a thick 3D cardiovascular tissue of the whole heart. (b,c) The pre-processed visualization along the xz and xy-axis using raw data. (d) 3D rendering highlighting the spatial organization of collagen fibers.
Fig. 2.
Fig. 2.
Process of estimating fiber orientation using both synthetic and biological datasets. Synthetic images are generated through diffusion models, creating diverse fiber patterns, which are then compared with actual biological fiber images captured via microscopy. Feature extraction is performed on both datasets using HOG, emphasizing the directionality and distribution of fiber orientations. These features are subsequently input into a SVR model, where the input layer consists of feature vectors processed through kernel functions in the hidden layer. The output layer sums these contributions to predict fiber orientation. The analysis culminates in detailed orientation maps, exemplified by yellow arrows on a sample image, providing comprehensive insights into the structural organization of fibers in synthetic and biological samples.
Fig. 3.
Fig. 3.
FFT Analysis for 2D Synthetic Data. (a-d) Lines with 45, 60 and 135 degree angles are produced as binary scale using MATLAB, and the graph of the analysis results is shown using 2D FFT and x axes represent to angle of line, y axis represent to frequency spectrum.
Fig. 4.
Fig. 4.
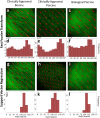
Comparison of fiber orientation estimation in different tissue samples using FFT and SVR. The top row (a-c) shows fiber orientation maps (red arrows) overlaid on green fluorescence images for clinically approved bovine (a), clinically approved porcine (b), and biological porcine (c) tissues analyzed using FFT. The corresponding histograms (d-f) depict the distribution of fiber angles obtained from FFT analysis, with angles ranging from 20 to 160 degrees. The bottom row (g-i) displays fiber orientation maps (red arrows) for the same tissue samples analyzed using SVR. The associated histograms (j-l) show the distribution of fiber angles derived from SVR analysis, with angles concentrated around 100 degrees. This comparison highlights the differences in fiber orientation results between FFT and SVR methods across different tissue types.
Fig. 5.
Fig. 5.
Analysis of Fiber Orientation via 2D FFT for clinically approved bovine, clinically approved porcine, and biological porcine samples. Eight samples were analyzed for each case, illustratingthemeanfiberorientationangles,accompaniedbystandarddeviationbars. These eight samples consist of four samples from four different pericardia, with two different locations each, providing comprehensive insights into fiber orientation variability across different anatomical sources and locations
Fig. 6.
Fig. 6.
3D Synthetic Torus Analysis Using 3D FFT. (a, b) Combined visualization showing the 3D structure of the helix and torus with detailed fiber orientation analysis using 3D FFT.
Fig. 7.
Fig. 7.
Visual representation and angle distribution of collagen fiber orientation. (a) and (d) show the collagen fiber structures obtained from the diffusion model. (b) and (e) are magnified views of the yellow highlighted areas in (a) and (d), respectively, providing a detailed view of fiber orientation within those regions. (c) and (f) are angle distribution histograms corresponding to the fiber structures shown in (a) and (d), respectively.
Fig. 8.
Fig. 8.
3D visualization and orientation analysis of fiber structures in clinically approved bovine, clinically approved porcine, and biological porcine tissues. a-c show 3D reconstructions of confocal microscopy slices, processed and visualized using Huygens, for clinically approved bovine (a), clinically approved porcine (b), and biological porcine (c) samples. d-f display the angular distribution of fiber orientations along the xy-axis (blue) and xz-axis (red), obtained through Fourier transform analysis in MATLAB. g-i provide the angular distribution of fiber orientations obtained from Support Vector Regression.
Fig. 9.
Fig. 9.
Comprehensive analysis of 3D collagen fiber orientation in chick embryo heart samples using advanced imaging and modeling techniques. The first row focuses on the right ventricle (RV), showing a 3D rendering of the heart (first column), a high-resolution 2D confocal microscopy image of collagen fibers (second column), a 3D vector field visualization of fiber orientations (third column), and a polar distribution plot illustrating predominant fiber orientation around 90 degrees (fourth column). The second row provides similar analyses for the left ventricle (LV), with corresponding visualizations and orientation data.

Update of

  • doi: 10.1364/opticaopen.28418294.

Similar articles

  • Prescription of Controlled Substances: Benefits and Risks.
    Preuss CV, Kalava A, King KC. Preuss CV, et al. 2025 Jul 6. In: StatPearls [Internet]. Treasure Island (FL): StatPearls Publishing; 2025 Jan–. 2025 Jul 6. In: StatPearls [Internet]. Treasure Island (FL): StatPearls Publishing; 2025 Jan–. PMID: 30726003 Free Books & Documents.
  • Short-Term Memory Impairment.
    Cascella M, Al Khalili Y. Cascella M, et al. 2024 Jun 8. In: StatPearls [Internet]. Treasure Island (FL): StatPearls Publishing; 2025 Jan–. 2024 Jun 8. In: StatPearls [Internet]. Treasure Island (FL): StatPearls Publishing; 2025 Jan–. PMID: 31424720 Free Books & Documents.
  • A comprehensive analysis of recent advancements in cancer detection using machine learning and deep learning models for improved diagnostics.
    Rai HM, Yoo J. Rai HM, et al. J Cancer Res Clin Oncol. 2023 Nov;149(15):14365-14408. doi: 10.1007/s00432-023-05216-w. Epub 2023 Aug 4. J Cancer Res Clin Oncol. 2023. PMID: 37540254 Free PMC article. Review.
  • Leveraging a foundation model zoo for cell similarity search in oncological microscopy across devices.
    Kalweit G, Klett A, Silvestrini P, Rahnfeld J, Naouar M, Vogt Y, Infante D, Berger R, Duque-Afonso J, Hartmann TN, Follo M, Bodurova-Spassova E, Lübbert M, Mertelsmann R, Boedecker J, Ullrich E, Kalweit M. Kalweit G, et al. Front Oncol. 2025 Jun 18;15:1480384. doi: 10.3389/fonc.2025.1480384. eCollection 2025. Front Oncol. 2025. PMID: 40606969 Free PMC article.
  • Management of urinary stones by experts in stone disease (ESD 2025).
    Papatsoris A, Geavlete B, Radavoi GD, Alameedee M, Almusafer M, Ather MH, Budia A, Cumpanas AA, Kiremi MC, Dellis A, Elhowairis M, Galán-Llopis JA, Geavlete P, Guimerà Garcia J, Isern B, Jinga V, Lopez JM, Mainez JA, Mitsogiannis I, Mora Christian J, Moussa M, Multescu R, Oguz Acar Y, Petkova K, Piñero A, Popov E, Ramos Cebrian M, Rascu S, Siener R, Sountoulides P, Stamatelou K, Syed J, Trinchieri A. Papatsoris A, et al. Arch Ital Urol Androl. 2025 Jun 30;97(2):14085. doi: 10.4081/aiua.2025.14085. Epub 2025 Jun 30. Arch Ital Urol Androl. 2025. PMID: 40583613 Review.

References

    1. Balasubramanian P., Prabhakaran M. P., Sireesha M., et al. , “Collagen in Human Tissues: Structure, Function, and Biomedical Implications from a Tissue Engineering Perspective,” Fortschritte der Hochpolymeren-Forschung 251, 173–206 (2013). 10.1007/12_2012_176 - DOI
    1. Schoen F., “Evolving Concepts of Cardiac Valve Dynamics The Continuum of Development, Functional Structure, Pathobiology, and Tissue Engineering,” Circulation 118(18), 1864–1880 (2008). 10.1161/CIRCULATIONAHA.108.805911 - DOI - PubMed
    1. Sarraf C. E., Harris A. B., McCulloch A. D., et al. , “Heart valve and arterial tissue engineering,” Cell Proliferation 36(5), 241–254 (2003). 10.1046/j.1365-2184.2003.00281.x - DOI - PMC - PubMed
    1. Gasser T. C., Ogden R. W., Holzapfel G. A., “Hyperelastic modelling of arterial layers with distributed collagen fibre orientations,” J. R. Soc. Interface. 3(6), 15–35 (2006). 10.1098/rsif.2005.0073 - DOI - PMC - PubMed
    1. Capulli A. K., MacQueen L. A., Sheehy S. P., et al. , “Fibrous scaffolds for building hearts and heart parts,” Adv. Drug Delivery Rev. 96, 83–102 (2016). 10.1016/j.addr.2015.11.020 - DOI - PMC - PubMed

LinkOut - more resources