Fluid dynamics in intracranial aneurysms treated with flow-diverting stents: effect of multiple geometrical parameters
- PMID: 40809994
- PMCID: PMC12341545
- DOI: 10.1017/jfm.2023.763
Fluid dynamics in intracranial aneurysms treated with flow-diverting stents: effect of multiple geometrical parameters
Abstract
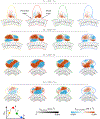
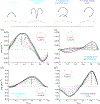
Characterizing the haemodynamics in intracranial aneurysms is of high interest as it impacts aneurysm growth, rupture and treatment, especially with flow-diverting stents (FDS). Flow in these geometries is known to depend on the Dean, Reynolds and Womersley numbers, , but is also influenced by geometrical parameters such as the sac shape or the size of the opening. Via particle image velocimetry, this parametric study aimed at evaluating the combined effects of , and the geometry of the aneurysmal sac on the haemodynamics before and after treatment with FDS. Eight ellipsoidal idealized aneurysm models were created with two curvatures of the parent vessel, two aspect ratios of the sac and two neck sizes. Before treatment, a single counter-rotating vortex, whose strength increases with and , as well as with the neck size and the aspect ratio, was observed in the sac for all but one geometry. After treatment with FDS, four different flow topologies were observed, depending on the geometry: no separation, separation for part of the cycle, two opposing vortices or a single counter-rotating vortex. A linear model with interaction revealed the predominant effect of and the curvature of the parent vessel on the haemodynamics before and after treatment. This work once more demonstrated the primary role of haemodynamics in the treatment of intracranial aneurysms with FDS. Future work will consider the complexity of patient-specific geometries, and their effects on both the haemodynamics in the sac and the porosity of the FDS.
Keywords: biomedical flows; blood flow.
Conflict of interest statement
Declaration of interests. The authors report no conflict of interest.
Figures


Similar articles
-
Prescription of Controlled Substances: Benefits and Risks.2025 Jul 6. In: StatPearls [Internet]. Treasure Island (FL): StatPearls Publishing; 2025 Jan–. 2025 Jul 6. In: StatPearls [Internet]. Treasure Island (FL): StatPearls Publishing; 2025 Jan–. PMID: 30726003 Free Books & Documents.
-
Comparison of Two Modern Survival Prediction Tools, SORG-MLA and METSSS, in Patients With Symptomatic Long-bone Metastases Who Underwent Local Treatment With Surgery Followed by Radiotherapy and With Radiotherapy Alone.Clin Orthop Relat Res. 2024 Dec 1;482(12):2193-2208. doi: 10.1097/CORR.0000000000003185. Epub 2024 Jul 23. Clin Orthop Relat Res. 2024. PMID: 39051924
-
Intravenous magnesium sulphate and sotalol for prevention of atrial fibrillation after coronary artery bypass surgery: a systematic review and economic evaluation.Health Technol Assess. 2008 Jun;12(28):iii-iv, ix-95. doi: 10.3310/hta12280. Health Technol Assess. 2008. PMID: 18547499
-
The Black Book of Psychotropic Dosing and Monitoring.Psychopharmacol Bull. 2024 Jul 8;54(3):8-59. Psychopharmacol Bull. 2024. PMID: 38993656 Free PMC article. Review.
-
Systemic pharmacological treatments for chronic plaque psoriasis: a network meta-analysis.Cochrane Database Syst Rev. 2021 Apr 19;4(4):CD011535. doi: 10.1002/14651858.CD011535.pub4. Cochrane Database Syst Rev. 2021. Update in: Cochrane Database Syst Rev. 2022 May 23;5:CD011535. doi: 10.1002/14651858.CD011535.pub5. PMID: 33871055 Free PMC article. Updated.
References
-
- Aenis M, Stancampiano AP, Wakhloo AK & Lieber BB 1997. Modeling of flow in a straight stented and nonstented side wall aneurysm model. Trans. ASME J. Biomech. Engng 119 (2), 206–212. - PubMed
Grants and funding
LinkOut - more resources
Full Text Sources
