. 2025 Jul 30:16:1622675.
doi: 10.3389/fpls.2025.1622675. eCollection 2025.

Chloroplast Z-ring dynamics is governed by conserved core regions of evolutionarily divergent FtsZs

Affiliations

Chloroplast Z-ring dynamics is governed by conserved core regions of evolutionarily divergent FtsZs

Lingyan Cao et al. Front Plant Sci. .

Abstract

The chloroplast FtsZ ring (Z ring) is assembled by two distinct FtsZ proteins, FtsZ2 and FtsZ1 (referred to as FtsZA and FtsZB in red algae). FtsZ2 confers stability to the Z ring, while FtsZ1 enhances its dynamics. Enhanced Z-ring dynamics is essential for Z-ring remodeling, which drives chloroplast constriction and division. However, the mechanisms underlying the distinct dynamic properties of the two FtsZs remain unclear. Here, we report that the conserved core regions are primarily responsible for the distinct dynamic properties observed in both plant and red algal FtsZs. We demonstrate that the conserved core region of FtsZ1 enhances the dynamics of FtsZ2 within coassembled filaments. Likewise, we show that the conserved core region of red algal FtsZB promotes the dynamics of coassembled FtsZA rings. Our findings provide evidence that the evolution of a second FtsZ protein represents a general mechanism to enhance the dynamics of the chloroplast Z ring.

Keywords: FtsZ-ring; chloroplast; division; dynamics; evolution.


Conflict of interest statement

The authors declare that the research was conducted in the absence of any commercial or financial relationships that could be construed as a potential conflict of interest.

Figures
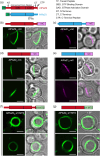
Figure 1
Figure 1
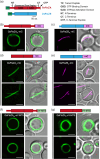
AtFtsZ Filament and Ring Morphologies in P. pastoris. (a) Structural features of AtFtsZ2 (top) and AtFtsZ1 (bottom). aa, amino acids. (b, c) Representative images of full-length A. thaliana FtsZs, lacking their predicted transit peptides (TPs) (Olson et al., 2010), expressed separately in P. pastoris. Specifically, the FtsZs expressed are as follows: FtsZ2-mCerulean (AtFtsZ2FL-mC), and FtsZ1-mCerulean (AtFtsZ1FL-mC). (b) AtFtsZ2FL-mC formed deep-curved but unclosed filamentous structures, while (c) AtFtsZ1FL-mC formed shallow-curved filaments. (d, e) Representative images of the core regions of AtFtsZ2-mCerulean (AtFtsZ2C-mC) or AtFtsZ1-mCerulean (AtFtsZ1C-mC) expressed separately in P. pastoris. Only shallow-curved filamentous structures were observed in cells expressing either (d) AtFtsZ2C-mC or (e) AtFtsZ1C-mC. (f, g) Representative images of FtsZ2FL-eYFP or FtsZ2C-eYFP fused to a membrane-tethering sequence (MTS) derived from Escherichia coli MinD (Szeto et al., 2003) at the C terminus (AtFtsZ2FL-eY-MTS), allowing AtFtsZ2FL-eY or FtsZ2C-eY filaments to associate with the membrane (Yoshida et al., 2016). Circular filamentous structures were observed in cells expressed with either (f) AtFtsZ2FL-eY-MTS or (g) AtFtsZ2C-eY-MTS. + BF, merge of fluorescent image with corresponding bright field. Bars are 2 μm.
Figure 2
Figure 2
The Conserved Core Regions Determine the Distinct Turnover Dynamics of AtFtsZ1 and AtFtsZ2 Filaments. FRAP (fluorescence recovery after photobleaching) analysis of the AtFtsZ filaments and rings in Pichia. FRAP experiments were conducted with either (a–f) mCerulean (mC) or (g–i) eYFP (eY) signals in Pichia cells expressing AtFtsZ proteins separately, as described in Figure 1 . Recovery of mC or eY fluorescence was recorded for 260 s following photobleaching. A two-binding-state equation was used to perform curve fitting using averaged recovery data (Sprague et al., 2004; Yoshida et al., 2016). R130 refers to the percentage of fluorescence recovered at 130 s post-bleaching. (a, d, g) Fluorescence images show AtFtsZ filaments and rings prior to photobleaching (Pre-bleach), at the time of photobleaching (Bleach), and at 130 and 260 s after photobleaching. The photobleached regions are indicated by white circles and arrowheads. The fluorescence intensity is indicated by the color scale bar with white the highest and black the lowest. Bars are 2 μm. Curve-fitting graphs derived from FRAP data collected from (b) AtFtsZ2FL-mC filaments, (c) AtFtsZ1FLmC filaments, (e) AtFtsZ2C-mC filaments, (f) AtFtsZ1C-mC filaments, (h) AtFtsZ2FL-eY-MTS rings, and (i) AtFtsZ2C-eY-MTS rings. Dashed lines show the average recovery of fluorescence 130 s after photobleaching (R130). Values represent mean ± SE; n indicates the number of FRAP cells.
Figure 3
Figure 3
The Conserved Core Regions Are Sufficient for the Dynamic Regulation of Coassembled AtFtsZ1/AtFtsZ2 Filaments. (a, b) Coexpression of (a) the full-length AtFtsZ1-mCerulean (AtFtsZ1FL-mC) and AtFtsZ2FL-eYFP-MTS (AtFtsZ2FL-eY-MTS), or (b) the core regions of AtFtsZ1-mCerulean (AtFtsZ1c-mC) and AtFtsZ2C-eYFP-MTS (AtFtsZ2c-eY-MTS) in Pichia. White dashed lines indicate the outline of Pichia cells. Bars are 2 μm. (c–h) FRAP analysis of AtFtsZ rings and filaments when coexpressed in Pichia. FRAP experiments were conducted with either eYFP (eY) for AtFtsZ2 or mCerulean (mC) for AtFtsZ1. (c, f) Fluorescence images show AtFtsZ rings and filaments prior to photobleaching (Pre-bleach), at the time of photobleaching (Bleach), and at 130 and 260 s after photobleaching. The photobleached regions are indicated by white circles and arrowheads. The fluorescence intensity is indicated by a color scale bar with white the highest and black the lowest. Bars are 2 μm. Curve-fitting graphs derived from the FRAP data collected simultaneously from coexpression of (d) AtFtsZ2FL-eY-MTS and (e) AtFtsZ1FL-mC rings, or from coexpression of (g) AtFtsZ2C-eY-MTS and (h) AtFtsZ1C-mC filaments. Dashed lines show the average recovery of fluorescence 130 s after photobleaching (R130). Values represent mean ± SE; n indicates the number of FRAP cells.
Figure 4
Figure 4
Flanking Regions Have Only Minor Influence on the Relative Dynamics of AtFtsZ1 and AtFtsZ2 Filaments. (a, b) Diagrams depicting the structures of the chimeric proteins (a) AtFtsZ2NT-Z1C-Z2CT (Z2NTZ1CZ2CT) and (b) AtFtsZ1NT-Z2C-Z1CT (Z1NTZ2CZ1CT). aa, amino acids. (c, d) Representative images of the chimeras, (c) Z2NTZ1CZ2CT-mCerulean (Z2NTZ1CZ2CT-mC) or (d) Z1NTZ2CZ1CT-mCerulean (Z1NTZ2CZ1CT-mC) expressed in Pichia. + BF, merge of fluorescent image with corresponding bright field. (e–g) FRAP analysis of the chimeric proteins Z2NTZ1CZ2CT-mC and Z1NTZ2CZ1CT-mC when expressed individually in Pichia. (e) Fluorescence images of the chimeras taken prior to photobleaching (Pre-bleach), at the time of photobleaching (Bleach), and at 130 and 260 s after photobleaching. White circles and arrowheads mark the photobleached regions. The fluorescence intensity of mCerulean (mC) is indicated by a color scale bar with white the highest and black the lowest. Bars are 2 μm. Curve-fitting graphs derived from the FRAP data collected from (f) Z2NTZ1CZ2CT-mC and (g) Z1NTZ2CZ1CT-mC. Dashed lines show the average recovery of fluorescence 130 s after photobleaching (R130). Values represent mean ± SE; n indicates the number of FRAP cells. Bars are as indicated.
Figure 5
Figure 5
GsFtsZ Filament and Ring Morphologies in P. pastoris. (a) Structural feature of G. sulphuraria FtsZA (GsFtsZA; top) and FtsZB (GsFtsZB; bottom). aa, amino acids. (b, c) Representative images of full-length G. sulphuraria FtsZs, lacking their predicted transit peptides (TPs) (Olson et al., 2010), expressed separately in Pichia. Specifically, the FtsZs expressed are as follows: GsFtsZA-mCerulean (GsFtsZAFL-mC), and GsFtsZB-mCerulean (GsFtsZBFL-mC). (b) GsFtsZAFL-mC formed ring-like structures around the cell boundary, while (c) the GsFtsZBFL-mC assembled into straight filament. (d, e) Representative images of the core regions of GsFtsZA-mCerulean (GsFtsZAC-mC) or GsFtsZB-mCerulean (GsFtsZBC-mC) expressed separately in P. pastoris. Only shallow-curved filamentous structures were observed in cells expressing either (d) GsFtsZAC-mC or (e) GsFtsZBC-mC. (f, g) Representative images of GsFtsZAFL-eYFP or GsFtsZAC-eYFP fused to a membrane-tethering sequence (MTS) derived from Escherichia coli MinD (Szeto et al., 2003) at the C terminus. Fusion of MTS to GsFtsZAC-eY (GsFtsZAC-eY-MTS) led to the formation of ring-like structures around the cell boundary. + BF, merge of fluorescent image with corresponding bright field. Bars are 2 μm.
Figure 6
Figure 6
The Core Regions Determine the Distinct Dynamics of Red Algal FtsZA and FtsZB Filaments in Galdieria sulpuraria. FRAP analysis of the GsFtsZ rings and filaments in Pichia. FRAP experiments were conducted with either (a–f) mCerulean (mC) or (g–i) eYFP (eY) signals in Pichia cells expressing GsFtsZ proteins separately, as described in Figure 5 . Recovery of mC or eY fluorescence was recorded for 260 s following photobleaching. A two-binding-state equation was used to perform curve fitting using averaged recovery data (Sprague et al., 2004; Yoshida et al., 2016). (a, d, g) Fluorescence images show GsFtsZ rings and filaments prior to photobleaching (Pre-bleach), at the time of photobleaching (Bleach), and at 130 and 260 s after photobleaching. The photobleached regions are indicated by white circles and arrowheads. The fluorescence intensity is indicated by a color scale bar with white the highest and black the lowest. Bars are 2 μm. Curve-fitting graphs derived from FRAP data collected from (b) GsFtsZAFL-mC rings, (c) GsFtsZBFLmC filaments, (e) GsFtsZAC-mC filaments, (f) GsFtsZBC-mC filaments, (H) GsFtsZAFL-eY-MTS rings, and (i) GsFtsZAC-eY-MTS rings. Dashed lines show the average recovery of fluorescence 130 s after photobleaching (R130). Values represent mean ± SE; n indicates the number of FRAP cells.
Figure 7
Figure 7
The Core Region of FtsZB Promote the Overall Dynamics of Coassembled Filaments with FtsZA. (a, b) Coexpression of (a) the full-length GsFtsZA-mCerulean (GsFtsZAFL-mC) and GsFtsZB-eYFP (GsFtsZBFL-eY), or (b) GsFtsZAFL-mC and the core region of GsFtsZB-eYFP (GsFtsZBC-eY) in Pichia. White dashed lines indicate the outline of Pichia cells. Bars are 2 μm. (c–h) FRAP analysis of GsFtsZ rings when coexpressed in Pichia. FRAP experiment was conducted with either mCerulean (mC) for GsFtsZA or eYFP (eY) for GsFtsZB. (c, f) Fluorescence images show GsFtsZ rings prior to photobleaching (Pre-bleach), at the time of photobleaching (Bleach), and at 130 and 260 s after photobleaching. The photobleached regions are indicated by white circles and arrowheads. The fluorescence intensity is indicated by a color scale bar with white the highest and black the lowest. Bars are 2 μm. Curve-fitting graphs derived from the FRAP data collected simultaneously from coexpression of (d) GsFtsZAFL-mC and (e) GsFtsZBFL-eY, or from coexpression of (g) GsFtsZAFL-mC and (h) GsFtsZBC-eY rings. Dashed lines show the average recovery of fluorescence 130 s after photobleaching (R130). Values represent mean ± SE; n indicates the number of FRAP cells.

Similar articles

References

    1. An J., Wang L., Hong C., Gao H. (2024). Evolution and functional differentiation of the C-terminal motifs of FtsZs during plant evolution. Mol. Biol. Evol. 41, 1–15. doi: 10.1093/molbev/msae145 - DOI - PMC - PubMed
    1. Bi E. F., Lutkenhaus J. (1991). FtsZ ring structure associated with division in Escherichia coli . Nature 354, 161–164. doi: 10.1038/354161a0 - DOI - PubMed
    1. Bisson-Filho A. W., Hsu Y. P., Squyres G. R., Kuru E., Wu F., Jukes C., et al. (2017). Treadmilling by FtsZ filaments drives peptidoglycan synthesis and bacterial cell division. Science 355, 739–743. doi: 10.1126/science.aak9973 - DOI - PMC - PubMed
    1. Buske P. J., Levin P. A. (2013). A flexible C-terminal linker is required for proper FtsZ assembly in vitro and cytokinetic ring formation in vivo . Mol. Microbiol. 89, 249–263. doi: 10.1111/mmi.12272 - DOI - PMC - PubMed
    1. Chen C., Cao L., Yang Y., Porter K. J., Osteryoung K. W. (2019). ARC3 activation by PARC6 promotes FtsZ-ring remodeling at the chloroplast division site. Plant Cell 31, 862–885. doi: 10.1105/tpc.18.00948 - DOI - PMC - PubMed

LinkOut - more resources