. 2025 Jul 30:16:1555082.
doi: 10.3389/fendo.2025.1555082. eCollection 2025.

Association between serum glucose potassium ratio and short- and long-term all-cause mortality in patients with sepsis admitted to the intensive care unit: a retrospective analysis based on the MIMIC-IV database

Affiliations

Association between serum glucose potassium ratio and short- and long-term all-cause mortality in patients with sepsis admitted to the intensive care unit: a retrospective analysis based on the MIMIC-IV database

Jiaqi Lou et al. Front Endocrinol (Lausanne). .

Abstract

Background: The glucose potassium ratio (GPR) is emerging as a biomarker for predicting clinical outcomes in various conditions. However, its value in sepsis patients admitted to the intensive care unit (ICU) remains unclear. Prior studies have shown conflicting results, with some indicating GPR's potential as an early warning indicator of metabolic decompensation in septic patients, while others found no significant association. The current study addresses these inconsistencies by conducting the first large-scale, systematic validation of GPR in ICU sepsis patients.

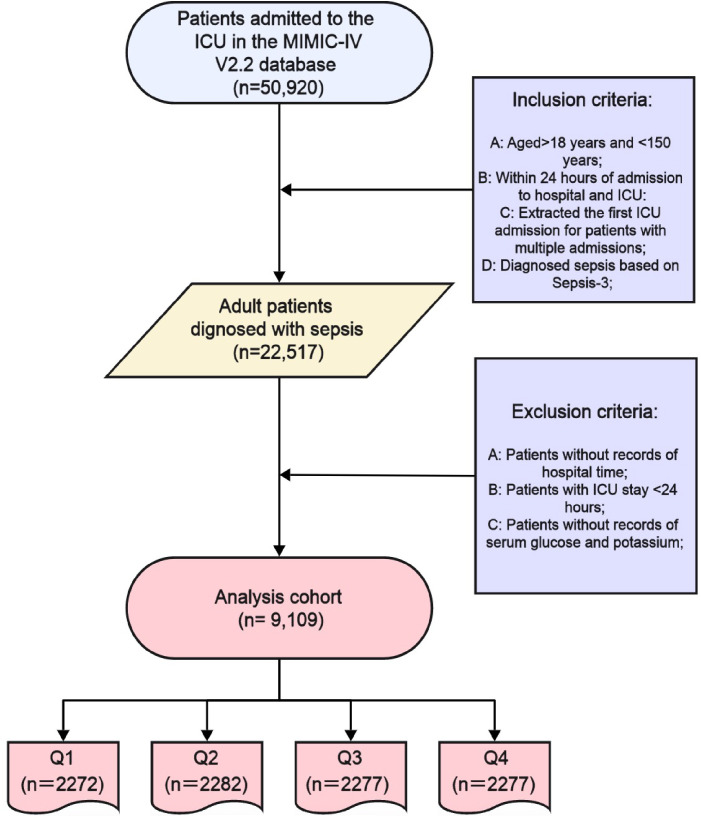
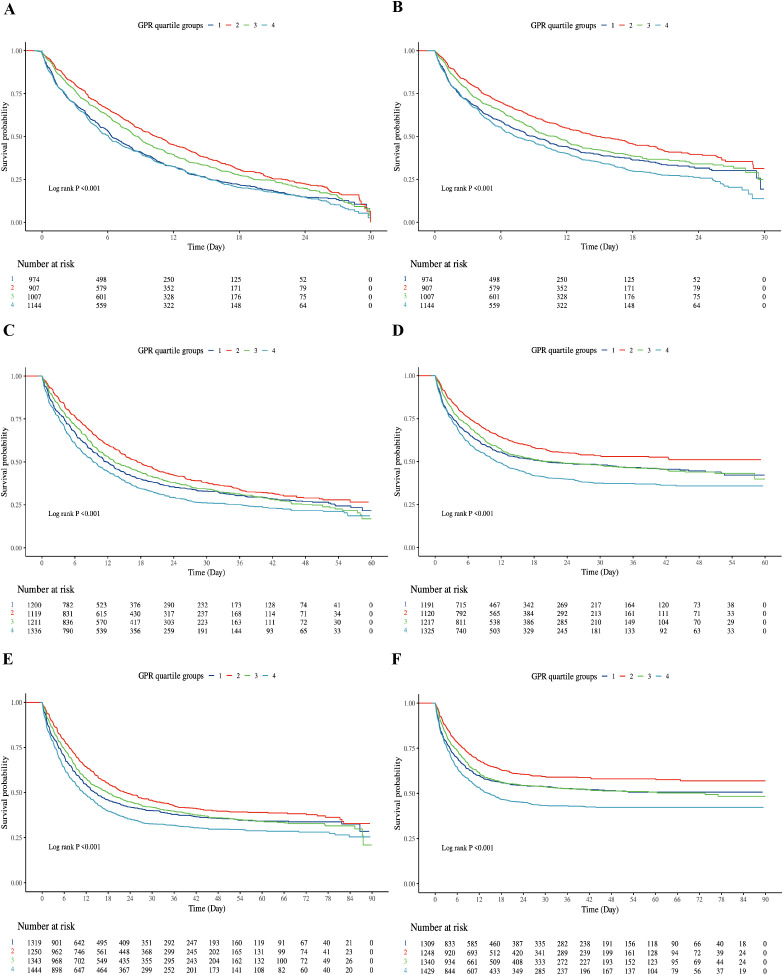
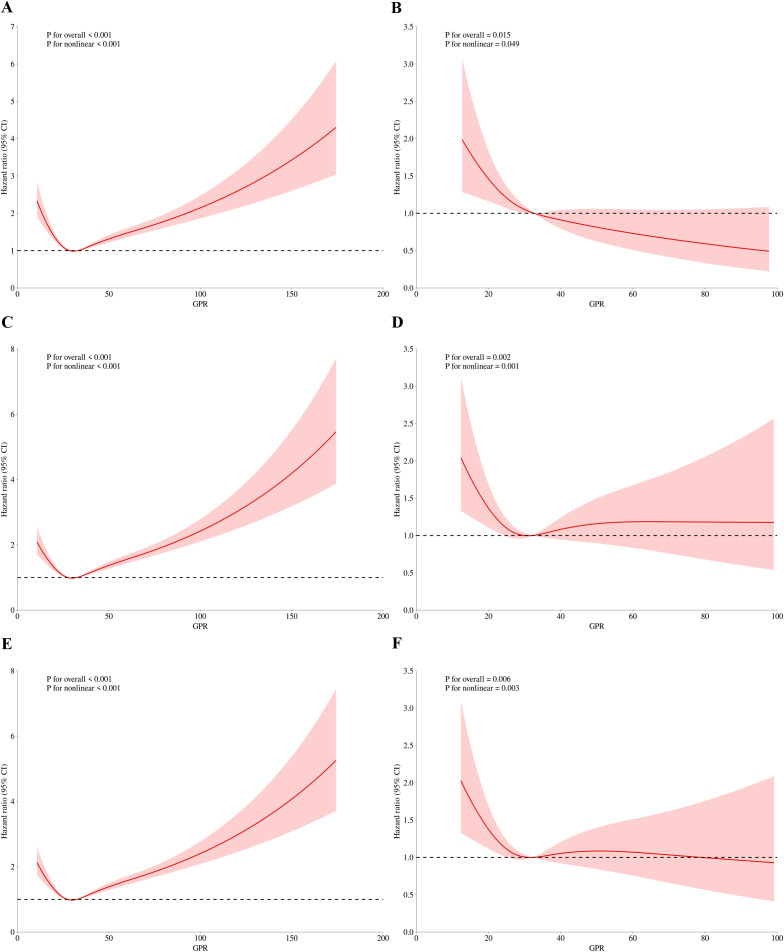
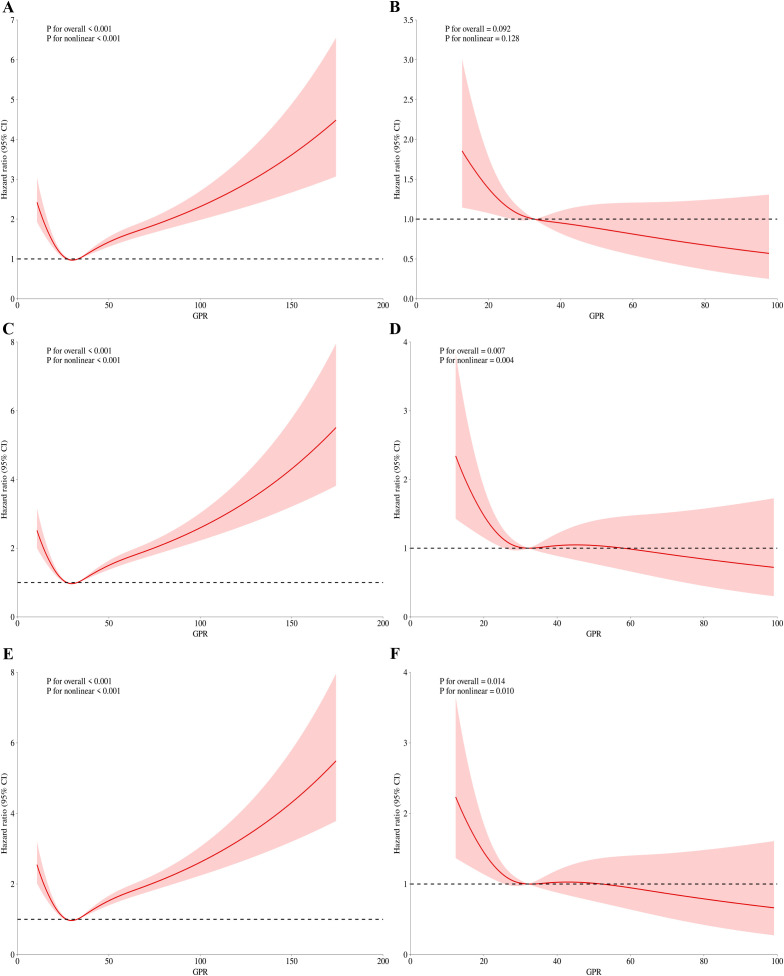
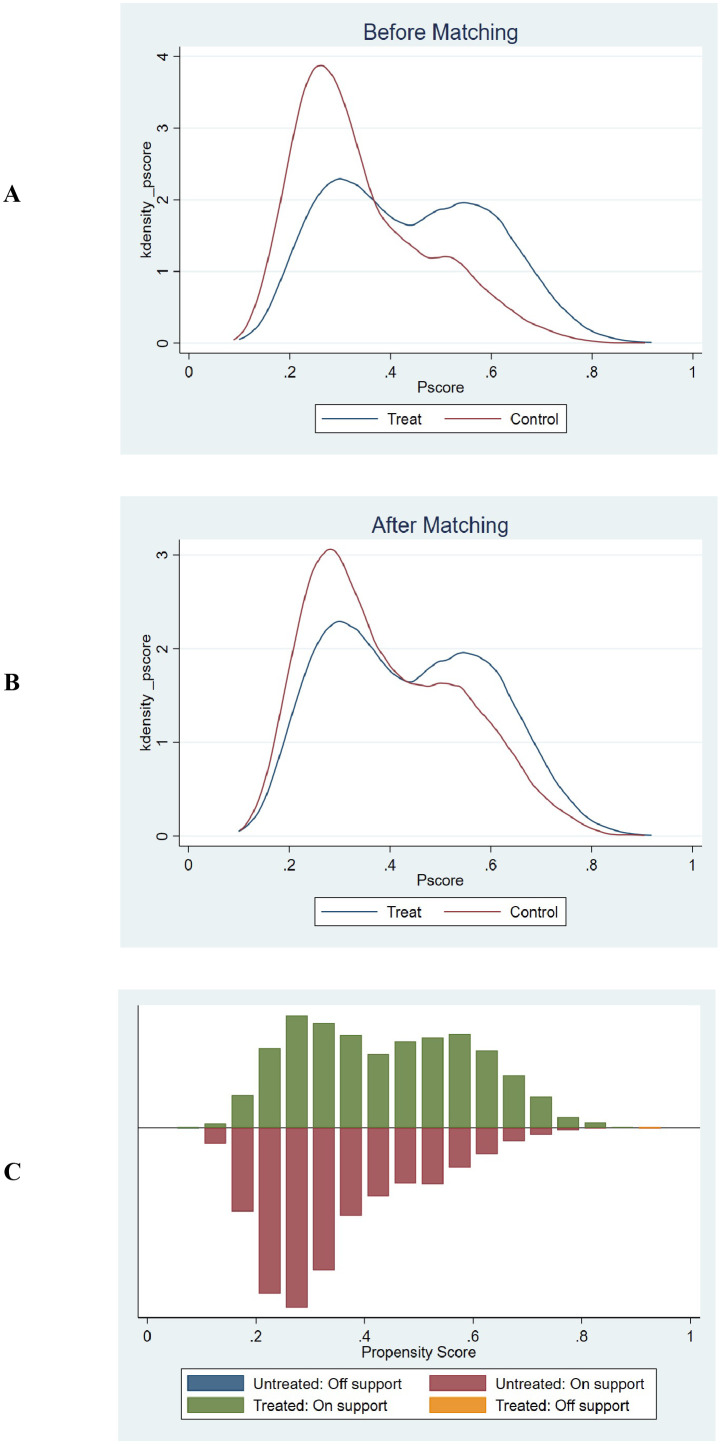
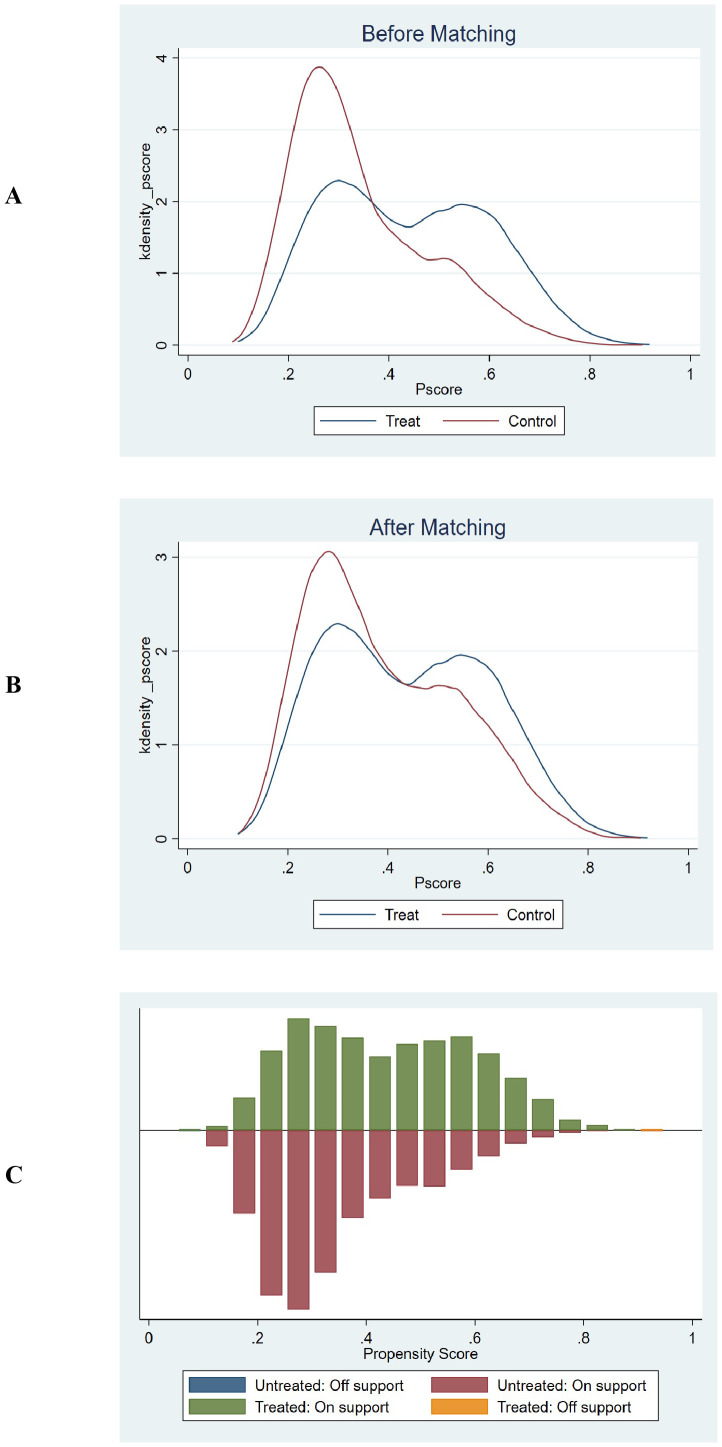
Methods: This retrospective cohort study used patient records from the MIMIC-IV database to examine outcomes in sepsis patients. The primary outcomes were hospital and ICU mortality at 30, 60, and 90 days. The correlation between GPR and these outcomes was evaluated using Kaplan-Meier survival analysis, Cox regression models, and restricted cubic spline (RCS) regression analysis. Sensitivity analyses, including Propensity Score Matching (PSM) and E-value Quantification and Subgroup analyses, were performed to assess the robustness of the findings.

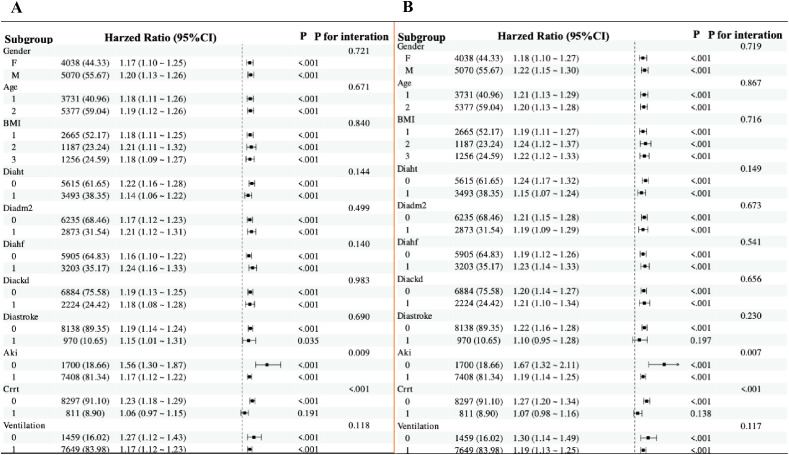
Results: The study included 9,108 patients with sepsis. Kaplan-Meier survival curves indicated progressively worsening survival probabilities from Q1 to Q4 for both hospital and ICU mortality across all time points. Cox analysis revealed that patients in the highest GPR quartile (Q4) had a significantly increased risk of mortality compared to those in the lowest quartile (Q1). A nonlinear relationship between GPR and mortality was identified, with a critical threshold at GPR=30. Subgroup analysis showed that the effect size and direction were consistent across different subgroups. Sensitivity analyses, including E-value quantification and propensity score matching, supported the robustness of our findings.

Conclusion: This study demonstrates that higher GPR levels strongly predict increased short- and long-term mortality risk in ICU-admitted sepsis patients. The composite nature of GPR, reflecting both hyperglycemia and hypokalemia, offers incremental prognostic value beyond single metabolic parameter. A critical threshold effect was observed at GPR=30, where risk substantially increased. This consistent association across patient subgroups positions GPR as a promising biomarker for identifying high-risk sepsis patients, warranting prospective validation.

Keywords: Cox regression; MIMIC; glucose potassium ratio; intensive care unit; long term; mortality; sepsis.


Conflict of interest statement

The authors declare that the research was conducted in the absence of any commercial or financial relationships that could be construed as a potential conflict of interest.

Figures

Figure 1
Figure 1
Selection of the study population from the MIMIC-IV database.
Figure 2
Figure 2
Kaplan-Meier survival curve of cumulative survival rate during hospitalization and ICU for groups. (A): Kaplan-Meier survival curve of cumulative survival rate during hospitalization for groups at 30-day. (B): Kaplan-Meier survival curve of cumulative survival rate during ICU for groups at 30-day. (C) Kaplan-Meier survival curve of cumulative survival rate during hospitalization for groups at 60-day. (D) Kaplan-Meier survival curve of cumulative survival rate during ICU for groups at 60-day. (E) Kaplan-Meier survival curve of cumulative survival rate during hospitalization for groups at 90-day. (F) Kaplan-Meier survival curve of cumulative survival rate during ICU for groups at 90-day. X-axis: Time (Days); Y-axis: Survival Probability. Log-rank test, all P < 0.001. Q1: dark blue; Q2: red; Q3: green; Q4: light blue.
Figure 3
Figure 3
RCS regression for GPR and in-hospital mortality. (A) Univariate analysis at 30-day (P for overall effect <0.001; P for nonlinearity <0.001). (B) Multivariate analysis at 30-day (P for overall effect <0.001; P for nonlinearity <0.001). (C) Univariate analysis at 60-day (P for overall effect <0.001; P for nonlinearity <0.001). (D) Multivariate analysis at 60-day (P for overall effect 0.007; P for nonlinearity 0.004). (E) Univariate analysis at 90-day (P for overall effect <0.001; P for nonlinearity <0.001). (F) Multivariate analysis at 90-day (P for overall effect 0.014; P for nonlinearity 0.010).
Figure 4
Figure 4
RCS regression for GPR and mortality during ICU admission. (A) Univariate analysis at 30-day (P for overall effect <0.001; P for nonlinearity <0.001). (B) Multivariate analysis at 30-day (P for overall effect <0.001; P for nonlinearity <0.001). (C) Univariate analysis at 60-day (P for overall effect <0.001; P for nonlinearity <0.001). (D) Multivariate analysis at 60-day (P for overall effect 0.007; P for nonlinearity 0.004). (E) Univariate analysis at 90-day (P for overall effect <0.001; P for nonlinearity <0.001). (F) Multivariate analysis at 90-day (P for overall effect 0.014; P for nonlinearity 0.010).
Figure 5
Figure 5
Forest plots for subgroup analyses of the association between GPR and mortality. (A) Subgroup analysis of the association between GPR and in-hospital mortality after covariate adjustment. (B) Subgroup analysis of the association between GPR and ICU mortality after covariate adjustment. For both plots, hazard ratios (HRs) and 95% confidence intervals (CIs) are shown. The analysis includes subgroups based on age (≤70 years and >70 years), sex, BMI (<27.4 kg/m², 27.4–31.2 kg/m², ≥31.2 kg/m²), hypertension, type 2 diabetes, heart failure, CKD, stroke, AKI, CRRT, and mechanical ventilation. The P value for interaction is provided for each subgroup analysis.
Figure 6
Figure 6
Propensity score matching and common support assessment regarding in-hospital mortality. (A) Kernel Density Estimation Before Matching: Displays the kernel density estimates of propensity scores for the treatment group (blue line) and control group (red line) prior to matching. The overlapping regions between the two curves indicate the initial common support area. Before matching, the density curves show some overlap, but there are also areas where the propensity scores of the treatment and control groups do not align closely, suggesting a limited common support region. (B) Kernel Density Estimation After Matching: Shows the kernel density estimates of propensity scores for the treatment group (blue line) and control group (red line) following matching. After matching, the density curves of the two groups are closely aligned across a wider range of propensity scores. This close alignment demonstrates an expanded common support region, indicating that the matching process has effectively balanced the distribution of propensity scores between the treatment and control groups. (C) Histogram of Common Support: Presents a histogram displaying the distribution of propensity scores for both the treatment and control groups. The green bars represent the treated observations within the common support range, the red bars represent the untreated observations within the common support range, the blue bar represents untreated observations outside the support, and the orange bar represents treated observations outside the support. The majority of observations fall within the common support range (indicated by the green and red bars), which means that only a minimal number of samples were excluded during the matching process. This ensures that the matched groups are highly comparable and reduces the potential for bias in the subsequent analysis.
Figure 7
Figure 7
Propensity score matching and common support assessment regarding in-ICU mortality. (A) Kernel Density Estimation Before Matching: Displays the kernel density estimates of propensity scores for the treatment group (blue line) and control group (red line) prior to matching. The overlapping regions between the two curves indicate the initial common support area. Before matching, the density curves show some overlap, but there are also areas where the propensity scores of the treatment and control groups do not align closely, suggesting a limited common support region. (B) Kernel Density Estimation After Matching: Shows the kernel density estimates of propensity scores for the treatment group (blue line) and control group (red line) following matching. After matching, the density curves of the two groups are closely aligned across a wider range of propensity scores. This close alignment demonstrates an expanded common support region, indicating that the matching process has effectively balanced the distribution of propensity scores between the treatment and control groups. (C) Histogram of Common Support: Presents a histogram displaying the distribution of propensity scores for both the treatment and control groups. The green bars represent the treated observations within the common support range, the red bars represent the untreated observations within the common support range, the blue bar represents untreated observations outside the support, and the orange bar represents treated observations outside the support. The majority of observations fall within the common support range (indicated by the green and red bars), which means that only a minimal number of samples were excluded during the matching process. This ensures that the matched groups are highly comparable and reduces the potential for bias in the subsequent analysis.

Similar articles

References

    1. Qian H, Shang W, Zhang S, Pan X, Huang S, Li H, et al. Trends and predictions of maternal sepsis and other maternal infections among women of childbearing age: a systematic analysis for the global burden of disease study 2019. Front Public Health. (2024) 12:1428271. doi: 10.3389/fpubh.2024.1428271, PMID: - DOI - PMC - PubMed
    1. Cheng S, Li Y, Sun X, Liu Z, Guo L, Wu J, et al. The impact of glucose metabolism on inflammatory processes in sepsis-induced acute lung injury. Front Immunol. (2024) 15:1508985. doi: 10.3389/fimmu.2024.1508985, PMID: - DOI - PMC - PubMed
    1. Li J, Nie M, Lu Z, Wang Y, Shen X. Efficacy of compound sodium acetate Ringer’s solution in early fluid resuscitation for children with septic shock: a preliminary retrospective cohort study. BMC Pediatr. (2024) 24:708. doi: 10.1186/s12887-024-05184-1, PMID: - DOI - PMC - PubMed
    1. Lou J, Xiang Z, Zhu X, Fan Y, Song J, Cui S, et al. A retrospective study utilized MIMIC-IV database to explore the potential association between triglyceride-glucose index and mortality in critically ill patients with sepsis. Sci Rep. (2024) 14:24081. doi: 10.1038/s41598-024-75050-8, PMID: - DOI - PMC - PubMed
    1. Liu S, Yang T, Jiang Q, Zhang L, Shi X, Liu X, et al. Lactate and lactylation in sepsis: A comprehensive review. J Inflammation Res. (2024) 17:4405–17. doi: 10.2147/JIR.S459185, PMID: - DOI - PMC - PubMed

LinkOut - more resources