. 2025 Jun 6;7(9):101475.
doi: 10.1016/j.jhepr.2025.101475. eCollection 2025 Sep.

Endothelial c-Maf prevents MASLD-like liver fibrosis by regulating chromatin accessibility to suppress pathogenic microvascular cell subsets

Affiliations

Endothelial c-Maf prevents MASLD-like liver fibrosis by regulating chromatin accessibility to suppress pathogenic microvascular cell subsets

Manuel Winkler et al. JHEP Rep. .

Abstract

Background & aims: Liver sinusoidal endothelial cells (LSECs) are highly specialized components of the hepatic vascular niche, regulating liver function and disease pathogenesis through angiocrine signaling. Recently, we identified GATA4 as a key transcription factor controlling LSEC development and protecting against liver fibrosis. As the transcription factor c-Maf was strongly downregulated in Gata4-deficient LSECs, we hypothesized that c-Maf might be an important downstream effector of GATA4 in LSEC differentiation and liver fibrogenesis.

Methods: Clec4g-iCre/Maf fl/fl (Maf LSEC-KO ) mice with LSEC-specific Maf deficiency were generated and liver tissue was analyzed histologically. LSECs were isolated for bulk RNA-seq, ATAC-seq, and single-cell (sc) RNA-seq analysis. Maf LSEC-KO livers were analyzed after MASH diet feeding. The expression of MAF and its targets was analyzed in published human scRNA-seq data.

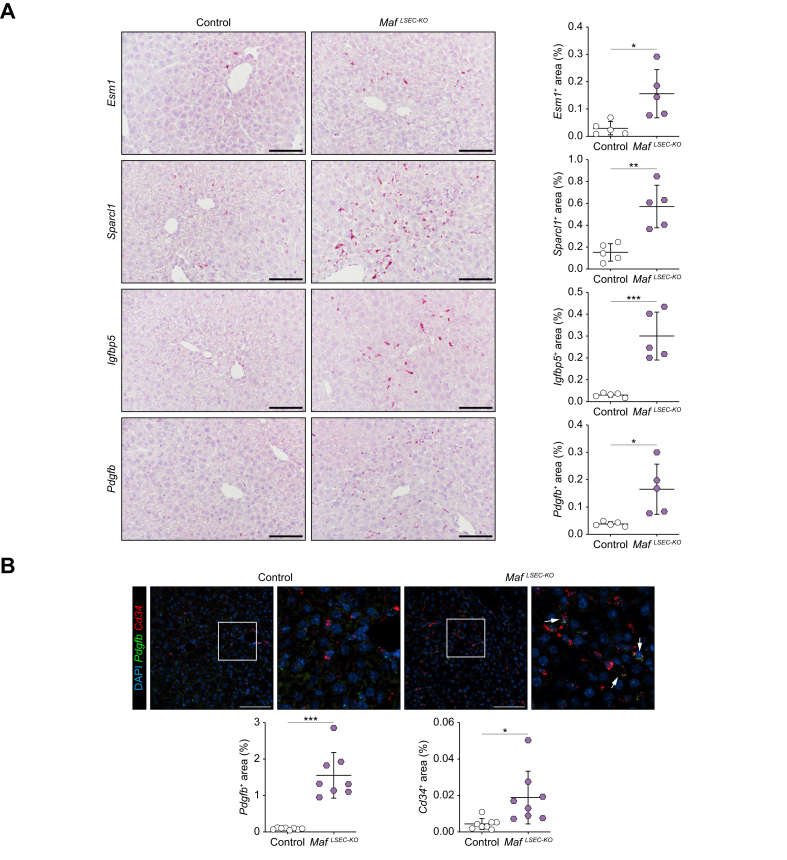
Results: Endothelial Maf deficiency resulted in perisinusoidal liver fibrosis (Sirius red 0.46% vs. 2.92%; p <0.05) without affecting metabolic liver zonation, accompanied by a switch from sinusoidal to continuous endothelial cell identity, which was aggravated upon MASH diet feeding (p <0.01). Furthermore, endothelial Maf deficiency caused LSEC proliferation (p <0.05) and expression of profibrotic angiocrine factors including Pdgfb, Igfbp5, Flrt2, and Cxcl12, among which FLRT2 (p <0.01) and CXCL12 (p <0.001) activated hepatic stellate cells in vitro. scRNA-seq revealed replacement of zonated LSEC subpopulations with capillarized, proliferative, sprouting and secretory endothelial cell subsets that promote liver fibrogenesis and angiogenesis. This fundamental dysregulation of LSEC gene expression and differentiation was caused by changes in chromatin accessibility and transcription factor activity following loss of Maf. Notably, endothelial MAF expression was also significantly reduced in human cirrhotic livers (p <0.0001).

Conclusions: Hepatic endothelial c-Maf protects against metabolic dysfunction-associated steatohepatitis-like liver fibrosis and regulates endothelial differentiation and zonation by controlling chromatin opening.

Impact and implications: This work builds on the known importance of liver sinusoidal endothelial cells in liver function and disease. Here, transcription factor c-Maf is identified as a master regulator in maintaining normal differentiation and zonation of liver sinusoidal endothelial cells, thereby protecting against the development of liver fibrosis/cirrhosis. The findings are significant for researchers and clinicians focusing on liver disease, as they suggest potential new targets for therapeutic intervention. These findings could instruct the development of novel preventive treatment options and antifibrotic therapy regimens as well as liver repair strategies, benefiting patients, clinicians and policy makers in the management of liver disease.

Keywords: ATAC-Seq analysis; Capillarization; Cirrhosis; Liver sinusoidal endothelial cells (LSEC); Single-cell RNA-Seq analysis.


Conflict of interest statement

The authors declare no competing interests. Please refer to the accompanying ICMJE disclosure forms for further details.

Figures

Image 1
Graphical abstract
Fig. 1
Fig. 1
Endothelial Maf deficiency leads to perisinusoidal liver fibrosis while metabolic zonation is preserved. (A) Maf ISH and Sirius red staining with quantification (n = 5, 6). (B) Immunofluorescence staining and quantification of COL1A1 (n = 5). (C) Tissue collagen assay of livers (n = 9, 12). (D) qPCR for Col1a1, Col3a1 and Pdgfrb using RNA from whole liver (n = 8). (E) Pdgfrb ISH in mouse livers (n = 5). (F) Immunofluorescence staining of GS and ARG1 (n = 8); and (G) CYP2E1 and RHBG in livers (n = 5). Scale bars: 100 μm. Mean ± SD. (A-E) Welch’s t test; ∗p <0.05; ∗∗p <0.01; ∗∗∗p <0.001. ISH, in situ hybridization.
Fig. 2
Fig. 2
Upregulation of continuous endothelial marker genes and proliferation marker Ki-67 in LSECs from MafLSEC-KO mice. (A) Immunofluorescence staining and quantification of LYVE1, EMCN, CD31, CD32, and STAB2 in livers (n = 5, 6, 8). (B) Immunofluorescence staining for Ki-67 and pan-endothelial marker PODXL and Ki-67 quantification (n = 5, 6). (C) TEM of livers (S = sinusoidal lumen, E = endothelial cell, F = fenestration, D = diaphragm, B = basement membrane, C = collagen fiber) (n = 1, 2). (A-B) Scale bars: 100 μm; (C) scale bars: 1 μm. Mean ± SD. (A [LYVE1, EMCN, STAB2], B) Welch’s t test; (A [CD31, CD32]) Mann-Whitney U test; ∗p <0.05; ∗∗p <0.01; ∗∗∗p <0.001. LSECs, liver sinusoidal endothelial cells; TEM, transmission electron microscopy.
Fig. 3
Fig. 3
Endothelial Maf deficiency causes increased expression of profibrotic angiocrine factors. (A) ISH and quantification for Esm1, Sparcl1, Igfbp5, and Pdgfb of livers (n = 5). (B) FISH and quantification for Pdgfb and Cd34 of livers (n = 8). Scale bars: 100 μm. Mean ± SD. (A [Igfbp5, Pdgfb], B [Pdgfb]) Welch’s t test; (A [Esm1, Sparcl1], B [Cd34]) Mann-Whitney U test; ∗p <0.05; ∗∗p <0.01; ∗∗∗p <0.001. FISH, fluorescence ISH; ISH, in situ hybridization.
Fig. 4
Fig. 4
Maf knockout aggravates MASH diet-induced liver fibrosis. (A) Sirius red staining and quantification of control and MafLSEC-KO livers after Chow or CDAA diet for 10 weeks (n = 4, 6). (B) Blood plasma levels of GLDH, ALT, and AST in control and MafLSEC-KO mice (n = 4, 6). (C) Immunofluorescence staining and quantification for CD31 and CD32 (n = 4, 6). (D) CYP2E1 and (E) ARG1 Immunohistochemistry staining of control and MafLSEC-KO livers after Chow or CDAA diet for 10 weeks (n = 4, 6). Scale bars: 100 μm. (A-C) two-way ANOVA, Tukey’s post hoc test; n.s. p ≥0.05; ∗p <0.05; ∗∗p <0.01; ∗∗∗p <0.001.; ∗∗∗∗p <0.0001. ALT, alanine aminotransferase; AST, aspartate aminotransferase; CDAA, choline-deficient, L-amino acid-defined; GLDH, glutamate dehydrogenase; LSECs, liver sinusoidal endothelial cells; MASH, metabolic dysfunction-associated steatohepatitis.
Fig. 5
Fig. 5
Dysregulation of transcription factors and angiocrine factors with a shift towards portal vein transcripts in Maf-deficient LSECs. Heat maps of (A) top significantly up- and downregulated genes, (B) transcription factors, and (C) angiocrine factors in LSECs. Gene ontology overrepresentation analyses of (D) upregulated and (E) downregulated genes. (F) Enrichment plots of portal vein, periportal, midzonal, pericentral, and central vein associated genes. NES, normalized enrichment score (n = 4). LSECs, liver sinusoidal endothelial cells.
Fig. 6
Fig. 6
Loss of endothelial Maf leads to major alterations in chromatin accessibility. (A) Bar plot of differentially accessible chromatin areas at promotor, genebody, and intergenic regions in LSECs upon Maf deficiency. (B) Alluvial plot illustrating concordance of ATAC-seq and RNA-seq data. (C) Volcano plot of TOBIAS footprinting analysis of ATAC-seq data from LSECs. (D) Venn diagrams of genes showing loss of c-Maf footprints and significant dysregulation at the RNA level. (E) Heatmap of the 20 top up- and downregulated genes at the RNA level with loss of c-Maf footprints. (F) Example gene tracks for selected genes Enpp6, Dnase1l3, and Stab2 with annotation for ATAC-seq signal and c-Maf footprints per genotype. ATAC-seq, assay for transposase-accessible chromatin with sequencing; LSECs, liver sinusoidal endothelial cells; RNA-seq, RNA sequencing.
Fig. 7
Fig. 7
Identification of novel cell clusters in LSECs upon endothelial Maf deficiency. (A) Genotype annotation in UMAP plot of scRNA-seq from control and MafLSEC-KO LSECs. (B) Annotation for identified clusters in scRNA-seq data. (C) Plot of cell cluster proportions per genotype. (D) Heatmap of identified clusters and their marker genes. (E) Annotation for the genes of interest (Cd34, Pdgfb, Mki67, Cxcl12, Igfbp5, Flrt2, Ly6c1, and Mmp15) in UMAP plot. (F) Violin plot of LSEC zonation scores per genotype (0 corresponds pericentral, 1 corresponds periportal). (G) Annotation for the zonation score quartiles per genotype in UMAP plot. (H) qPCR for COL1A1 using LX-2 cell RNA after stimulation with CXCL12, FLRT2, IGFBP5 and PDGF-BB (n = 5). (H [CXCL12, FLRT2, IGFBP5]) unpaired t test; (H [PDGF-BB]) Mann-Whitney U test; n.s. p >0.05; ∗∗p <0.01; ∗∗∗p <0.001. LSECs, liver sinusoidal endothelial cells; scRNA-seq, single-cell RNA sequencing; UMAP, uniform manifold approximation and projection.
Fig. 7
Fig. 7
Identification of novel cell clusters in LSECs upon endothelial Maf deficiency. (A) Genotype annotation in UMAP plot of scRNA-seq from control and MafLSEC-KO LSECs. (B) Annotation for identified clusters in scRNA-seq data. (C) Plot of cell cluster proportions per genotype. (D) Heatmap of identified clusters and their marker genes. (E) Annotation for the genes of interest (Cd34, Pdgfb, Mki67, Cxcl12, Igfbp5, Flrt2, Ly6c1, and Mmp15) in UMAP plot. (F) Violin plot of LSEC zonation scores per genotype (0 corresponds pericentral, 1 corresponds periportal). (G) Annotation for the zonation score quartiles per genotype in UMAP plot. (H) qPCR for COL1A1 using LX-2 cell RNA after stimulation with CXCL12, FLRT2, IGFBP5 and PDGF-BB (n = 5). (H [CXCL12, FLRT2, IGFBP5]) unpaired t test; (H [PDGF-BB]) Mann-Whitney U test; n.s. p >0.05; ∗∗p <0.01; ∗∗∗p <0.001. LSECs, liver sinusoidal endothelial cells; scRNA-seq, single-cell RNA sequencing; UMAP, uniform manifold approximation and projection.
Fig. 8
Fig. 8
Downregulation of endothelial MAF in cirrhotic human livers. (A) UMAP plot of endothelial cells from human cirrhotic and control livers. (B) Bar plot of cell counts mapped to the identified clusters. (C) Violin plot of MAF expression per cell cluster. (D) Violin plot of MAF expression per phenotype. (E) Violin plot for pericentral, midzonal, and periportal LSECs per phenotype. Violin plots of (F) IGFBP5, (G) PDGFB, and (H) FLRT2 expression per cell cluster. cvECs, central vein endothelial cells; LSECs, liver sinusoidal endothelial cells; pvECs, portal vein endothelial cells; UMAP, uniform manifold approximation and projection; VSMCs, vascular smooth muscle cells.

References

    1. Koch P.-S., Lee K.H., Goerdt S., et al. Angiodiversity and organotypic functions of sinusoidal endothelial cells. Angiogenesis. 2021;24:289–310. doi: 10.1007/s10456-021-09780-y. - DOI - PMC - PubMed
    1. Koch P.S., Olsavszky V., Ulbrich F., et al. Angiocrine Bmp2 signaling in murine liver controls normal iron homeostasis. Blood. 2017;129:415–419. doi: 10.1182/blood-2016-07-729822. - DOI - PMC - PubMed
    1. Latour C., Besson-Fournier C., Gourbeyre O., et al. Deletion of BMP6 worsens the phenotype of HJV-deficient mice and attenuates hepcidin levels reached after LPS challenge. Blood. 2017;130:2339–2343. doi: 10.1182/blood-2017-07-795658. - DOI - PubMed
    1. Leibing T., Geraud C., Augustin I., et al. Angiocrine Wnt signaling controls liver growth and metabolic maturation in mice. Hepatology. 2018;68:707–722. doi: 10.1002/hep.29613. - DOI - PMC - PubMed
    1. Schmid C.D., Olsavszky V., Reinhart M., et al. ALK1 controls hepatic vessel formation, angiodiversity, and angiocrine functions in hereditary hemorrhagic telangiectasia of the liver. Hepatology. 2023;77:1211–1227. doi: 10.1002/hep.32641. - DOI - PMC - PubMed

LinkOut - more resources