

New Insights Into Slow Reading: Behavioral and Electrophysiological Analyses of Visual Word Recognition in Arabic
- PMID: 40810321
- PMCID: PMC12351673
- DOI: 10.1111/ejn.70223
New Insights Into Slow Reading: Behavioral and Electrophysiological Analyses of Visual Word Recognition in Arabic
Abstract
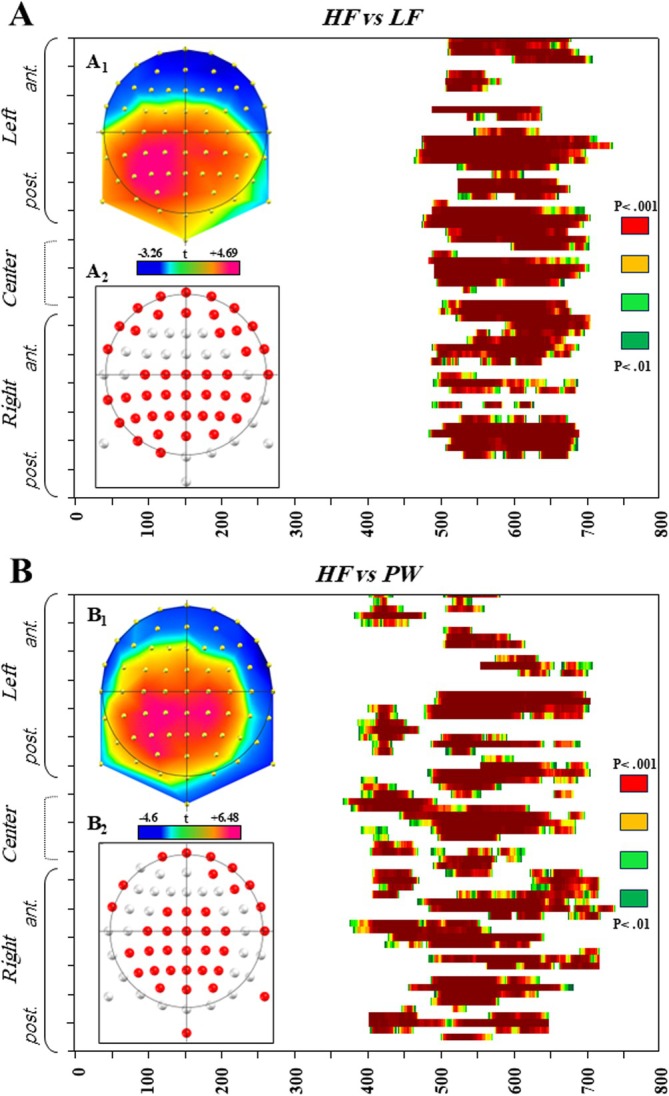
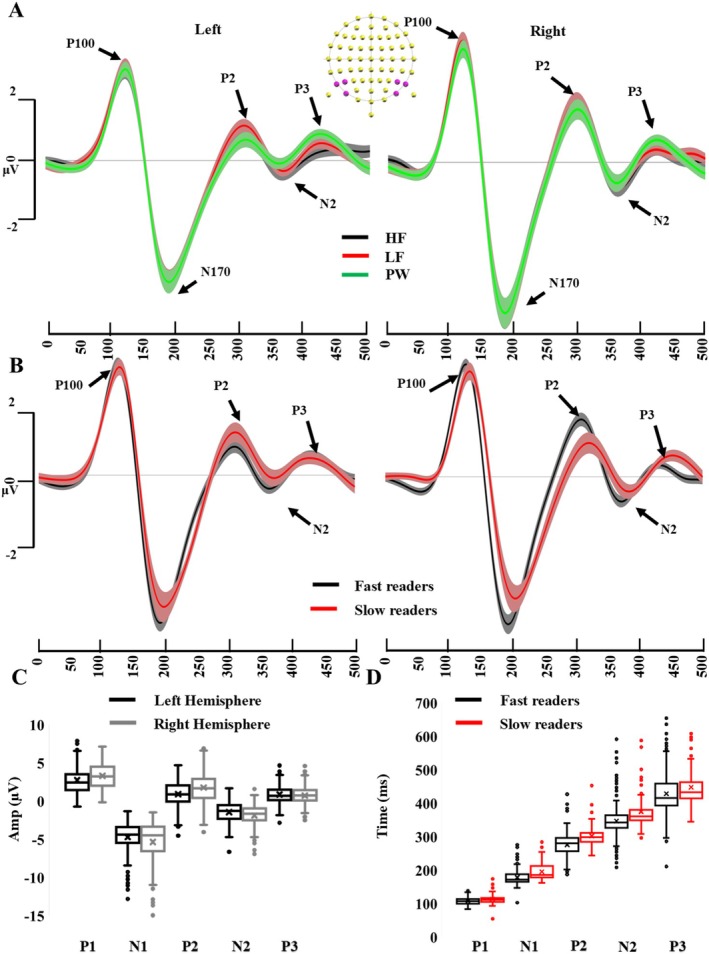
This study investigated the behavioral and electrophysiological differences between fast and slow readers among Arabic-speaking university students. We employed a classification methodology similar to that used in the rate versus accuracy approach of dyslexia subtyping. Fifty-five native Arabic-speaking university students participated in a lexical decision task involving high-frequency (HF) words, low-frequency (LF) words, and pseudowords (PWs). Behavioral and event-related potentials (ERPs) data were collected during the task. Participants were categorized as fast or slow readers based on their mean reaction time (RT) across all conditions, with those with RTs below the 65th percentile classified as fast readers and those with RTs above the 75th percentile classified as slow readers. Behaviorally, we observed a frequency effect, with faster RTs for HF words compared to LF words and PWs. At the electrophysiological level, we found a reader effect on the latency of the early ERP components (N170, P2, N2, and P3), with earlier peak latencies for fast readers. Additionally, the P600 component showed a larger amplitude and earlier peak for HF words compared to LF words and PWs. Fast readers exhibited a larger P600 amplitude and an earlier P600 peak for HF words compared to slow readers. These findings provide novel insights into word recognition processes in Arabic-speaking adults, shedding light on the neural mechanisms underlying differences between fast and slow readers. The results are discussed in relation to previous research on word recognition in both typical and dyslexic readers.
Keywords: P600 component; accuracy‐based dyslexia; component amplitude; event‐related potentials (ERPs); visual word processing; word frequency.
© 2025 The Author(s). European Journal of Neuroscience published by Federation of European Neuroscience Societies and John Wiley & Sons Ltd.
Conflict of interest statement
The authors declare no conflicts of interest.
Figures

Similar articles
-
Phonological, orthographic, and semantic processing during sentence reading in adults with dyslexia: Behavioral and neural correlates.Int J Psychophysiol. 2025 Aug;214:113209. doi: 10.1016/j.ijpsycho.2025.113209. Epub 2025 Jul 4. Int J Psychophysiol. 2025. PMID: 40619103
-
Assessing sensitivity to semantic and syntactic information in deaf readers: An ERP study.Neuropsychologia. 2025 Aug 13;215:109171. doi: 10.1016/j.neuropsychologia.2025.109171. Epub 2025 May 15. Neuropsychologia. 2025. PMID: 40381885 Free PMC article.
-
Reading subtyping of Arabic-speaking university students: a contribution to the accuracy vs. rate model of dyslexia.Ann Dyslexia. 2025 Jul;75(2):241-261. doi: 10.1007/s11881-025-00323-4. Epub 2025 Feb 13. Ann Dyslexia. 2025. PMID: 39946079 Free PMC article.
-
Phonics training for English-speaking poor readers.Cochrane Database Syst Rev. 2012 Dec 12;12:CD009115. doi: 10.1002/14651858.CD009115.pub2. Cochrane Database Syst Rev. 2012. Update in: Cochrane Database Syst Rev. 2018 Nov 14;11:CD009115. doi: 10.1002/14651858.CD009115.pub3. PMID: 23235670 Updated.
-
Phonological Awareness Skills in Thai-Speaking Children: A Scoping Review.Int J Lang Commun Disord. 2025 Sep-Oct;60(5):e70099. doi: 10.1111/1460-6984.70099. Int J Lang Commun Disord. 2025. PMID: 40729430 Free PMC article.
References
-
- Abdelhadi, S. , Ibrahim R., and Eviatar Z.. 2011. “Perceptual Load in the Reading of Arabic: Effects of Orthographic Visual Complexity on Detection.” Writing Systems Research 3, no. 2: 117–127.
-
- Abou‐Ghazaleh, A. , Khateb A., and Nevat M.. 2018. “Lexical Competition Between Spoken and Literary Arabic: A New Look Into the Neural Basis of Diglossia Using fMRI.” Neuroscience 393: 83–96. - PubMed
-
- Abou‐Ghazaleh, A. , Khateb A., and Nevat M.. 2020. “Language Control in Diglossic and Bilingual Contexts: An Event‐Related fMRI Study Using Picture Naming Tasks.” Brain Topography 33, no. 1: 60–74. - PubMed
-
- Al‐Hamouri, F. , Maestu F., Del Río D., et al. 2005. “Brain Dynamics of Arabic Reading: A Magnetoencephalographic Study.” NeuroReport 16, no. 16: 1861–1864. - PubMed
-
- Andrews, S. 1992. “Frequency and Neighborhood Effects on Lexical Access: Lexical Similarity or Orthographic Redundancy?” Journal of Experimental Psychology: Learning, Memory, and Cognition 18, no. 2: 234.
MeSH terms
Grants and funding
LinkOut - more resources
Full Text Sources
Research Materials
Miscellaneous
