. 2025 Sep 1;5(9):1541-1551.
doi: 10.1158/2767-9764.CRC-25-0168.

Loss of Sorting Nexin 10 Accelerates KRAS-Induced Pancreatic Tumorigenesis

Affiliations

Loss of Sorting Nexin 10 Accelerates KRAS-Induced Pancreatic Tumorigenesis

Kohinoor Khan et al. Cancer Res Commun. .

Abstract

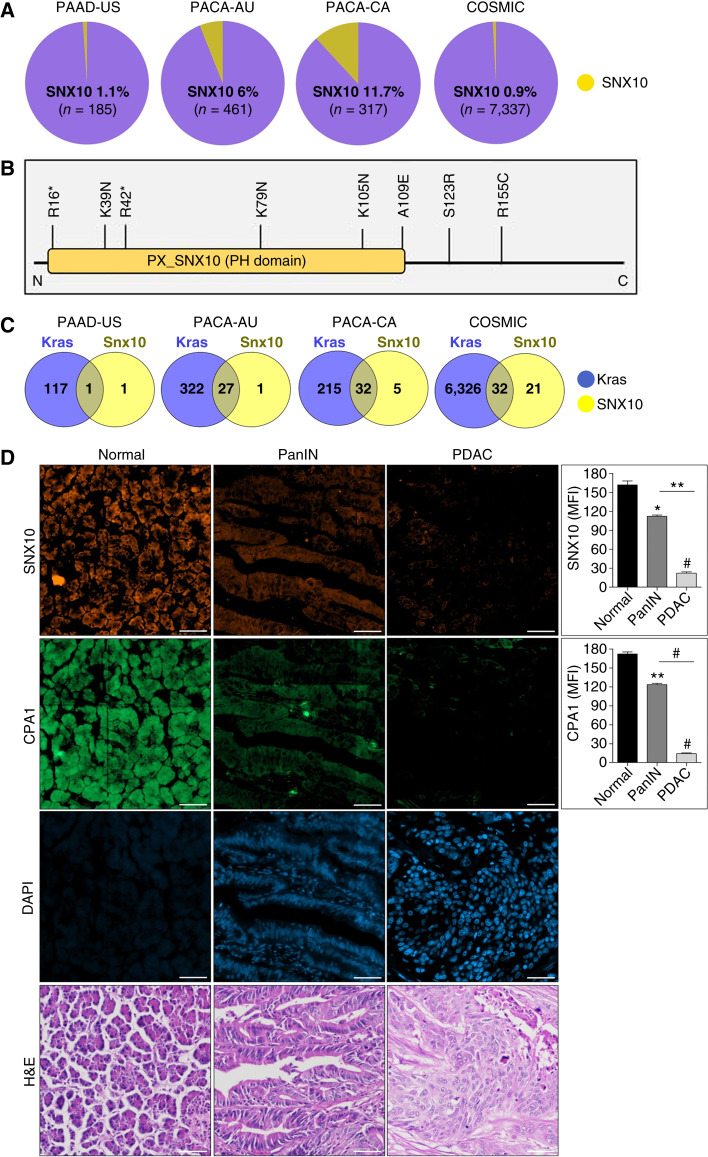
Pancreatic ductal adenocarcinoma (PDAC), one of the most aggressive forms of pancreatic cancer, is associated with poor survival outcomes and currently ranks as the third leading cause of cancer-related death in the United States. Despite its clinical significance, the mechanisms of PDAC development and progression remain, in part, poorly understood. In this study, we provide evidence of a novel role of sorting nexin 10 (SNX10), a member of the sorting nexin family, in the regulation of KRAS-induced pancreatic carcinogenesis. We demonstrate that SNX10 is downregulated in PDAC, especially in advanced cases. Furthermore, mutational analysis revealed SNX10 genetic alterations in PDAC cases. Functional studies demonstrated that SNX10 overexpression in human PDAC cells inhibited cell proliferation and colony formation. Moreover, SNX10 overexpression induced G1-phase cell-cycle arrest and decreased KRAS signaling activity. Using a novel Snx10 knockout mouse crossed with a Kras-driven PDAC model, we observed reduced survival, increased tumor cell proliferation, enhanced aggression, and heightened inflammation. Collectively, these findings highlight SNX10 as a tumor suppressor candidate in PDAC and underscore its promise as a foundation for new therapeutic approaches.

Significance: SNX10 plays a crucial role in reducing pancreatic tumorigenesis. This discovery offers valuable insights into PDAC's biology and the development of new effective treatments.


Conflict of interest statement

No disclosures were reported.

Figures

Figure 1
Figure 1
SNX10 genetic alterations and expression in human PDAC. A, Interrogation of PDAC from ICGC (https://dcc.icgc.org) and COSMIC (https://cancer.sanger.ac.uk/cosmic), showing mutations in the SNX10 gene. B, A schematic of the SNX10 gene shows the distribution of the mutations in the coding region (https://cancer.sanger.ac.uk/cosmic). C, Venn diagrams of SNX10 mutations that exist in conjunction with Kras gain-of-function alterations and overlap among SNX10 and Kras in PDAC (ICGC and COSMIC datasets; https://dcc.icgc.org/ and https://cancer.sanger.ac.uk/cosmic). D, TMA of normal, PanIN, and PDAC samples (left) stained with fluorescent IHC for CPA1 (green) and SNX10 (orange) expression. Scale bar, 20 μm. Quantification (right) of mean fluorescence intensity (MFI) of SNX10 and CPA1. Results indicate a progressive reduction in SNX10 and CPA1 expression from PanIN through advanced PDAC stages. Statistically significant differences *, P < 0.05; **, P < 0.01; and #, P < 0.001 are represented as mean ± SEM. H&E, hematoxylin and eosin; PH, Phox homology.
Figure 2
Figure 2
OE of SNX10 decreased cell proliferation in AsPC1 and HPAF-II PDAC cell lines. A, SNX10 transfection confirmation in AsPC1 and HPAF-II cells by qPCR fold change expression. Actin was used as a reference gene. B, Western blot of control vs. SNX10 OE with GAPDH was used as loading control for cell lines AsPC1 (left) and HPAF-II (right). C, Cell proliferation via MTT (absorbance at 570 nm) of AsPC1 (left) and HPAF-II (right) over 72 hours. D, The growth curve assay of AsPC1 (left) and HPAF-II (right) determined the growth rate over 7 days. E, Representative images of control vs. SNX10 OE colony-forming ability in AsPC1 and HPAF-II cell lines. F, Quantification of colony numbers in each group observed in E. Cell-cycle analysis of OE of SNX10 in (G) AsPC1 and (H) HPAF-II cells by flow cytometry shows that the percentage of cells in the G1 phase (blue) is higher than in the G2 phase (red) and S-phase (green) in the SNX10 OE group compared with the control. Cell-cycle data were analyzed using Floreada.io https://floreada.io/analysis. I and J, Quantification of cell-cycle analysis of the SNX10 OE group at all time points (24, 48, and 72 hours) compared with the control group in both AsPC1 and HPAF-II cell lines. Data are representative of three independent experiments. Statistically significant differences *, P < 0.05; **, P < 0.01; and #, P < 0.001 are represented as mean ± SEM. MW, molecular weight; OD, optical density; PI-A, propidium iodide area.
Figure 3
Figure 3
OE of SNX10 participated in regulating the protumorigenic protein expression. A, Western blot of control vs. SNX10 OE in AsPC1 and HPAF-II cell lines probing for the expression of protumorigenic markers. Protumorigenic markers probed for both total and phosphorylation of SRC, STAT3, and ERK expression and SNX10 (48 hours after treatment). Three independent western blots were performed, and the same blot was stripped for all the genes. B, Quantification of relative protein expression of genes in each group from A, with GAPDH used as a loading control. AsPC1 cell line is shown at the top, and HPAF-II at the bottom. Data are representative of three independent experiments. Statistically significant differences *, P < 0.05; **, P < 0.01; and #, P < 0.001 are represented as mean ± SEM. SNX10 OE was compared with the control group. MW, molecular weight.
Figure 4
Figure 4
Loss of Snx10 leads to adverse outcomes in PDAC. Kaplan–Meier curves of (A) KC (n = 12) and KCSfl/fl (n = 12) group (P = 0.0016). B, KPC (n = 12) and KPCSfl/fl (n = 14) group (P = 0.0049). Survival analyses were performed using the log-rank (Mantel–Cox) test. C and D, Pancreas weight measured in KC (n = 12), KCSfl/fl (n = 12), KPC (n = 12), and KPCSfl/fl (n = 14). E and F, Pancreas size measured in KC (n = 12), KCSfl/fl (n = 12), KPC (n = 12), and KPCSfl/fl (n = 14). G and H, Representative hematoxylin and eosin stains of KC (n = 12), KCSfl/fl (n = 12), KPC (n = 12), and KPCSfl/fl (n = 14). Scale bar, 20 μm. I and J, Pie charts represent the percentage incidence of poorly differentiated, moderately differentiated, chronic pancreatitis, and well-differentiated in KC (n = 12), KCSfl/fl (n = 12), KPC (n = 12), and KPCSfl/fl (n = 14). Statistically significant differences *, P < 0.05; **, P < 0.01; and #, P < 0.001 are represented as mean ± SEM.
Figure 5
Figure 5
Depletion of Snx10 enhances malignancy markers in PDAC mice: A–D, Number of mice per group: P48 Cre (control mouse, n = 4), KPC (n = 4), KPCSfl/fl (n = 4), KC (n = 4), and KCSfl/fl (n = 4; PDAC mouse). All scale bars, 100 μm. A, Masson’s trichrome staining representative (left) images and quantification (right) of total collagen (percentage of area fraction; blue signal). B, Representative IHC images (left) and quantification (right) for the ductal marker CK19 and percentage of positive cells (brown signal). C, Representative IHC images (left) and quantification (right) for the cell proliferation marker Ki-67 and percentage of positive cells (brown signal). D, Representative IHC images (left) and quantification (right) for the macrophage marker F4/80 and percentage of positive cells (brown signal). Significance levels *, P < 0.05; **, P < 0.01; and #, P < 0.001 are represented as mean ± SEM.

Similar articles

References

    1. Rahib L, Wehner MR, Matrisian LM, Nead KT. Estimated projection of US cancer incidence and death to 2040. JAMA Netw Open 2021;4:e214708. - PMC - PubMed
    1. Siegel RL, Miller KD, Jemal A. Cancer statistics, 2020. CA Cancer J Clin 2020;70:7–30. - PubMed
    1. Siegel RL, Giaquinto AN, Jemal A. Cancer statistics, 2024. CA Cancer J Clin 2024;74:12–49. - PubMed
    1. Siegel RL, Kratzer TB, Giaquinto AN, Sung H, Jemal A. Cancer statistics, 2025. CA Cancer J Clin 2025;75:10–45. - PMC - PubMed
    1. Waddell N, Pajic M, Patch AM, Chang DK, Kassahn KS, Bailey P, et al. Whole genomes redefine the mutational landscape of pancreatic cancer. Nature 2015;518:495–501. - PMC - PubMed

MeSH terms