

Altered effective connectivity of emotion perception and regulation networks during an emotional face perception task in adults with alcohol use disorder
- PMID: 40810908
- PMCID: PMC12354520
- DOI: 10.1007/s00429-025-02992-8
Altered effective connectivity of emotion perception and regulation networks during an emotional face perception task in adults with alcohol use disorder
Abstract
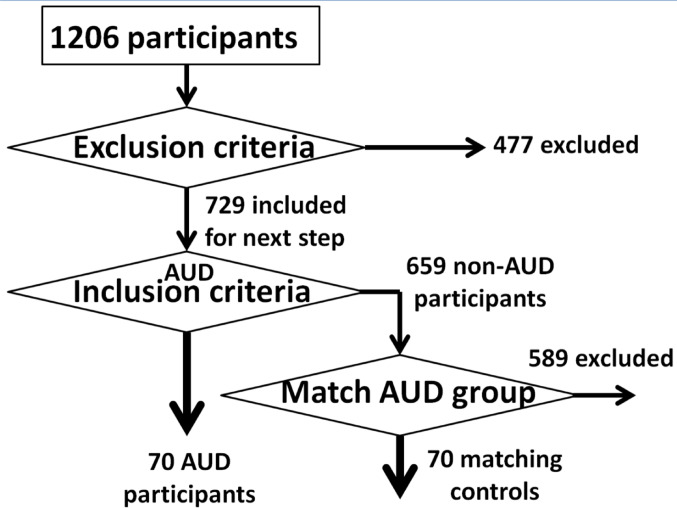
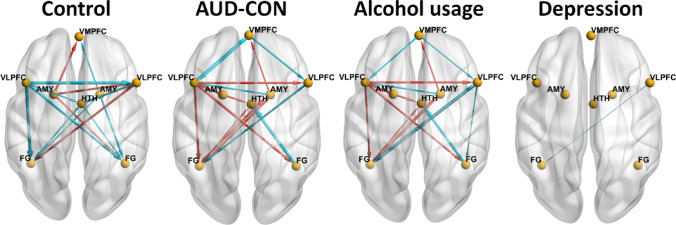
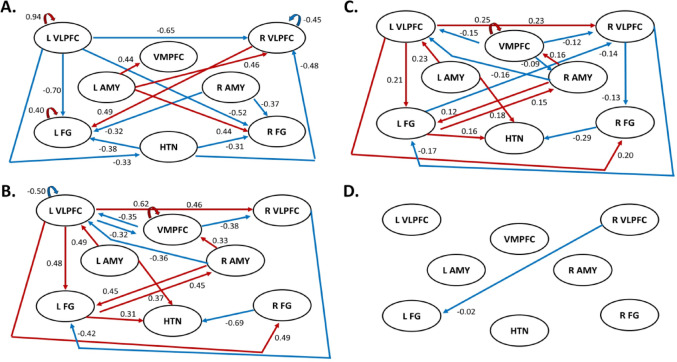
Impairments in emotional regulation and mood symptoms are interrelated and associated with alcohol use disorder (AUD) risk, but the underlying aberrant neural circuitry involved is poorly understood. In the present study, we examined alterations in effective (directional) connectivity (EC) during emotional face processing in individuals with and without AUD. We utilized functional MRI data from the Human Connectome Project obtained during an emotional face processing task in 70 participants with AUD and 70 controls (CON). Focusing on ventromedial prefrontal cortex (VMPFC), bilateral ventrolateral prefrontal cortex (VLPFC), amygdala (AMY), and fusiform gyrus (FG), and right (R) hypothalamus (HTN) nodes, we performed dynamic causal modeling analysis to test group-level differences in EC. Linear regressions characterized EC relationships with measures of cumulative alcohol exposure and depression and anxiety. Compared to CON participants, AUD participants had lower ECs from VMPFC → bilateral VLPFC, left (L)-VLPFC → L-VLPFC and VMPFC, R-VLPFC → L-FG, R-FG → HTN, and R-AMY → L-VLPFC; and greater ECs from VMPFC → VMPFC, L-VLPFC → R-VLPFC and bilateral FG, L-FG → R-AMY and HTN, R-AMY → VMPFC and L-FG, and L-AMY → HTN connectivities. In regression analyses, these cortical-to-cortical and cortical-to-subcortical ECs were associated with cumulative alcohol exposure. EC from R-VLPFC to L-FG was negatively associated with depression. Individuals with AUD have disrupted EC in cortical-to-cortical and cortical-to-subcortical circuits during emotional face processing in brain regions purported to govern emotion control, which may explain linkages between cumulative alcohol exposure and depression.
Keywords: Alcohol use disorder; Cumulative alcohol exposure; Depression; Dynamic causal modeling; Effective connectivity; Emotional face perception.
© 2025. The Author(s).
Conflict of interest statement
Declarations. Competing interests: The authors declare no competing interests. Ethical approval: The Human Connectome Project (HCP) was approved by the Washington University in St. Louis Institutional Review Board. All experiments were performed in accordance with relevant guidelines and regulations. Use of HCP data in this current report was approved by the Virginia Commonwealth University Institutional Review Board. Consent to participate: Written informed consent was obtained from all HCP study participants whose data was used in the preparation of this article. Consent to publication: Not applicable.
Figures
Similar articles
-
The VLPFC-Engaged Voluntary Emotion Regulation: Combined TMS-fMRI Evidence for the Neural Circuit of Cognitive Reappraisal.J Neurosci. 2023 Aug 23;43(34):6046-6060. doi: 10.1523/JNEUROSCI.1337-22.2023. Epub 2023 Jul 28. J Neurosci. 2023. PMID: 37507228 Free PMC article.
-
Connectivity Changes Following Episodic Future Thinking in Alcohol Use Disorder.Brain Connect. 2024 Dec;14(10):550-559. doi: 10.1089/brain.2024.0025. Epub 2024 Nov 4. Brain Connect. 2024. PMID: 39302073
-
Altered effective connectivity among face-processing systems in major depressive disorder.J Psychiatry Neurosci. 2024 May 1;49(3):E145-E156. doi: 10.1503/jpn.230123. Print 2024 May-Jun. J Psychiatry Neurosci. 2024. PMID: 38692692 Free PMC article.
-
Preclinical and clinical sex differences in the effects of alcohol on measures of brain dopamine: a systematic review.Biol Sex Differ. 2025 Apr 8;16(1):24. doi: 10.1186/s13293-025-00706-7. Biol Sex Differ. 2025. PMID: 40200334 Free PMC article.
-
Common and distinct neural correlates of facial emotion processing in social anxiety disorder and Williams syndrome: A systematic review and voxel-based meta-analysis of functional resonance imaging studies.Neuropsychologia. 2014 Nov;64:205-17. doi: 10.1016/j.neuropsychologia.2014.08.027. Epub 2014 Sep 4. Neuropsychologia. 2014. PMID: 25194208
References
-
- Achenbach TM (2009) The Achenbach system of empirically based assessment (ASEBA): development, findings, theory, and applications. University of Vermont, Research Center of Children, Youth & Families, Burlington
-
- Babor TF, Caetano R (2006) Subtypes of substance dependence and abuse: implications for diagnostic classification and empirical research. Addiction 101(Suppl 1):104–110 - PubMed
-
- Baranger DAA, Demers CH, Elsayed NM, Knodt AR, Radtke SR, Desmarais A, Few LR, Agrawal A, Heath AC, Barch DM, Squeglia LM, Williamson DE, Hariri AR, Bogdan R (2020) Convergent evidence for predispositional effects of brain Gray matter volume on alcohol consumption. Biol Psychiatry 87:645–655 - PMC - PubMed
MeSH terms
Grants and funding
LinkOut - more resources
Full Text Sources
Medical
