. 2025 Aug 14;10(18):e190149.
doi: 10.1172/jci.insight.190149. eCollection 2025 Sep 23.

Photon and particle radiotherapy induce redundant modular chemotaxis of human lymphocytes

Affiliations

Photon and particle radiotherapy induce redundant modular chemotaxis of human lymphocytes

Joscha A Kraske et al. JCI Insight. .

Abstract

Radiotherapy triggers chemokine release and leukocyte infiltration in preclinical models through activation of the senescence-associated secretory phenotype (SASP). However, effects of irradiation on senescence and SASP in human tissue and in the context of particle radiotherapy remain unclear. Here, we analyzed chemokine patterns after radiotherapy of human pancreatic tumors and cancer cell lines. We show that irradiated tumor cells coexpressed SASP chemokines in defined modules. These chemokine modules correlated with infiltration of distinct leukocyte subtypes expressing cognate receptors. We developed a patient-derived pancreatic tumor explant system, which verified our identified radiation-induced chemokine modules. Chemokine modules were partially conserved in cancer cells in response to photon and particle irradiation, showing a dose-dependent plateau effect, and induced subsequent migration of NK and T cell populations. Hence, our work reveals redundant interactions of cancer cells and immune cells in human tissue, suggesting that targeting multiple chemokines is required to efficiently perturb leukocyte infiltration after photon or particle radiotherapy.

Keywords: Cellular senescence; Chemokines; Immunology; Oncology; Radiation therapy.


Figures
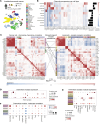
Figure 1
Figure 1. Modular chemokine expression enables redundant leukocyte cancer cell interactions in irradiated pancreatic cancer.
(A) Schema and uniform manifold approximation and projection (UMAP) of single-nucleus RNA-sequencing data from pancreatic cancers after chemoradiotherapy from Hwang et al. (35) with color code indicating cell type (n = 97,987 cells). The most frequently applied protocols included FOLFIRINOX (± nivolumab, ± losartan) followed by hypofractionated (hypofrct.10 × 3 Gy), normofractionated (normofrct., 28 × 1.8 Gy), and stereotactic body radiotherapy (SBRT, 6 × 6 Gy) with concurrent capecitabine or 5-fluorouracil. (B) Chemokines in the irradiated pancreas are predominantly expressed in cancer cells. Heatmap indicating mean z-scored (across n = 97,987 cells) chemokine expression per cell type and row average per cell type. (C) Chemokine expression in cancer cells (left, n = 10,862) and chemokine receptor expression in immune cells (right, n = 9,768) is highly modular. Heatmaps indicating Spearman’s correlation coefficients and correlated chemokine/chemokine receptor modules retrieved by hierarchical clustering are highlighted by colored side bars. Connecting lines between modules indicate the significance of potential receptor–ligand interactions as estimated by a permutation test. (D) Chemokine modules are expressed across multiple patients (n = 21). (E) Chemokine receptor modules show cell type–specific expression (n = 12 cell types). (F) Chemokine modules are correlated with infiltration of specific leukocyte subsets expressing cognate receptors. Spearman’s correlation coefficients between mean chemokine module scores and abundance of infiltrating immune cells (as % of leukocytes) per patient (n = 21) are indicated as color code and the P values as dot sizes.
Figure 2
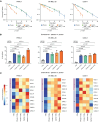
Figure 2. Photon irradiation induces modular SASP chemokine responses in an ex vivo pancreatic tumor model.
(A) Schema of experimental design. (B and C) p21 is expressed in cell lysates of irradiated pancreatic cancer explants. Shown are (B) a representative immunoblot image and (C) dot plot (mean ± SD) indicating p21 density normalized to β-actin as determined in 3 independent Western blot experiments with explants from 3 patients. P value was calculated using unpaired t test. (D) SA-β-Gal is expressed in explants treated with 10 or 20 Gy photon radiation. Shown are representative microscopy images of SA-β-Gal and eosin staining of pancreatic cancer explant sections. (E) Radiotherapy induces SASP factors in explants. Dot plots showing SASP factor scores (mean fold change of 10 established SASP factors, CCL2, CCL4, CCL5, CXCL1, CXCL8, CXCL10, ICAM1, IL1a, IL6, TNFa, ± SD relative to 0 Gy) in n = 3 patients in 3 independent experiments. P values were calculated using 2-tailed 1-sample t tests. (F) Chemokines are secreted by pancreatic tumor explants after irradiation. Dot plots showing mean relative concentrations (fold change of unirradiated) ± SD of indicated chemokines (n = 3 patients).
Figure 3
Figure 3. Photon irradiation induces dose-dependent senescence and chemokine release in vitro.
(A) Photon irradiation induces the senescence marker β-galactosidase in human pancreatic cancer (PANC-1), melanoma (SK-MEL-28), and osteosarcoma (SJSA-1) cells as quantified by semiautomated microscopy (Methods). Shown is the percentage of SA-β-Gal–positive cells in 3 independent experiments (mean ± SD) 4 days after irradiation. P values were calculated using 1-way ANOVA, and significance was determined using the Holm-Šídák method. *P < 0.05, **P < 0.01, ****P < 0.0001. (B) Cellular senescence in PANC-1 cells is time dependent. Shown is the percentage of SA-β-Gal–positive cells in 3 independent experiments (mean ± SD). P values were calculated using paired t tests. (C and D) Induction of module 1 and 4 chemokines in PANC-1 cancer cells by photon irradiation is dose dependent. Chemokine concentrations in conditioned media after application of indicated radiation doses were determined in n = 3 independent experiments by flow cytometric bead-based immunoassays. (C) Shown are mean z-scored concentrations of indicated chemokines. (D) Shown are concentrations (mean ± SD) of indicated chemokines. (E) Fractioned radiotherapy induces cellular senescence. PANC-1 cancer cells were irradiated with indicated doses. For fractionation, cells were irradiated for 5 consecutive days. Shown is the percentage of SA-β-Gal–positive cells in 3 independent experiments (mean ± SD) on day 7 after start of radiotherapy. (D and E) P values were calculated with 1-way ANOVA and significance testing using the Holm-Šídák method for multiple comparisons. (F) Fractionated radiotherapy induces chemokine secretion. Indicated are relative chemokine concentrations in conditioned media of PANC-1 cancer cells irradiated with 0 Gy or 5 × 2 Gy normalized to control (mean ± SD). P values were calculated using unpaired t tests.
Figure 4
Figure 4. Photon irradiation–induced SASP triggers directional lymphocyte chemotaxis in vitro.
(A) Photon irradiation (40 Gy) induces chemokine release by cancer cells as determined using a flow cytometric bead-based immunoassay. Shown are relative chemokine concentrations normalized to 0 Gy (mean ± SD). P values were calculated using unpaired t tests. (B) Photon irradiation of cancer cells causes human lymphocyte chemotaxis as determined by a flow cytometric modified Boyden chamber assay. Shown are migration indices (boxes indicating interquartile range, bar median, and whiskers range) of indicated immune cell types from 3 independent experiments and n = 6 healthy donors per cell line. P values were calculated using paired t tests.
Figure 5
Figure 5. Particle irradiation induces cellular senescence and SASP.
(A) Carbon ion irradiation inhibits clonogenic survival more strongly as compared with protons or photons. Dots indicate the surviving fraction of cells (mean ± SD) from n = 3 independent experiments. The connecting regression line was fitted using a linear quadratic model. P values were calculated using a mixed effects model. (B) Photon and particle irradiation induce SA-β-Gal. Shown is the percentage (mean ± SD) of SA-β-Gal–positive cells treated as indicated from n = 3 independent experiments. P values were calculated using 1-way ANOVA with determination of significance using the Holm-Šídák method or unpaired t tests (zig-zag line). (C) Photon and particle irradiation induce chemokine modules 1 and 4. Indicated are mean z-scored concentrations from n = 5 (PANC-1), n = 6 (SK-MEL-28), or n = 3 (SJSA-1) independent experiments as determined by flow cytometric bead-based immunoassays.
Figure 6
Figure 6. Particle irradiation induces directional lymphocyte migration.
Photon, proton, and carbon ion irradiation of (A) PANC-1 or (B) SK-MEL-28 cancer cells induces lymphocyte chemotaxis in a flow cytometric modified Boyden chamber assay. Indicated are migration indices (boxes indicating interquartile range, bar median, and whiskers range) of immune cell subsets from n = 8 donors for each cell line from 4 independent experiments. P values were calculated using paired t tests.

References

    1. Muñoz-Espín D, Serrano M. Cellular senescence: from physiology to pathology. Nat Rev Mol Cell Biol. 2014;15(7):482–496. doi: 10.1038/nrm3823. - DOI - PubMed
    1. Herranz N, Gil J. Mechanisms and functions of cellular senescence. J Clin Invest. 2018;128(4):1238–1246. doi: 10.1172/JCI95148. - DOI - PMC - PubMed
    1. López-Otín C, et al. The hallmarks of aging. Cell. 2013;153(6):1194–1217. doi: 10.1016/j.cell.2013.05.039. - DOI - PMC - PubMed
    1. Lopes-Paciencia S, et al. The senescence-associated secretory phenotype and its regulation. Cytokine. 2019;117:15–22. doi: 10.1016/j.cyto.2019.01.013. - DOI - PubMed
    1. Coppé J-P, et al. Senescence-associated secretory phenotypes reveal cell-nonautonomous functions of oncogenic RAS and the p53 tumor suppressor. PLoS Biol. 2008;6(12):2853–2868. doi: 10.1371/journal.pbio.0060301. - DOI - PMC - PubMed

MeSH terms