. 2025 Aug 26;44(8):116148.
doi: 10.1016/j.celrep.2025.116148. Epub 2025 Aug 12.

High-speed voltage imaging of action potentials in molecular layer interneurons reveals sensory-driven synchrony that augments movement

Affiliations

High-speed voltage imaging of action potentials in molecular layer interneurons reveals sensory-driven synchrony that augments movement

Spencer T Brown et al. Cell Rep. .

Abstract

Testing whether the synchrony of action potential firing is a cerebellar coding mechanism requires simultaneous recording, with high temporal fidelity, from populations of identified neurons. Here, we used targeted one-photon voltage imaging at 2-4 kHz to record action potentials from groups of ∼10-300 molecular layer interneurons (MLIs) expressing a positively tuned, genetically encoded voltage indicator, FORCE1f or pAce. In awake resting mice, crus I MLIs fired brief (∼1-ms) spikes at 20-60 spikes/s. Sensory stimuli of air puffs to the whiskers evoked short-latency (<10 ms) increases in spiking probability. In most trials, >50% of MLIs fired synchronously with 4-ms temporal precision. The magnitude of puff-evoked whisks correlated tightly with the trial-by-trial percentage of synchrony. Brief optogenetic stimulation of MLIs was sufficient to induce and augment whisker protraction, whereas overriding MLI inhibition by stimulating target Purkinje cells reduced protractions, providing direct evidence that sensory-evoked spike synchrony can generate movement.

Keywords: CP: Neuroscience; Purkinje; cerebellum; parallel fiber; prediction; sensorimotor; whisker.


Conflict of interest statement

Declaration of interests F.S.-P. holds a US patent (#US9606100 B2) that encompasses the design of the FORCE1f indicator used in this article.

Figures
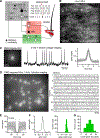
Figure 1.
Figure 1.. Voltage imaging of MLIs with FORCE1f
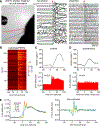
(A) Circuit diagram of the cerebellum and whisking-related afferent and efferent pathways. Black, inhibitory neurons; white, excitatory neurons. Vg, trigeminal ganglion; Vn, trigeminal nuclei; MF, mossy fiber; GrC, granule cell; MLI, molecular layer interneuron, Pkj, Purkinje cell; CbN, cerebellar nuclei; vIRt, vibrissal intermediate reticular formation; VIIn, facial nucleus. Inset, schematic depicting spikes in four converging Purkinje cells synchronously inhibited by sensory input to the whiskers, disinhibiting a CbN cell. (B) Expression of FORCE1f in crus I MLIs in vivo. (C) A single MLI (left) imaged at 3,000 fps showing raw, high-SNR action potentials (middle). Right, overlay of individual (gray) and mean (black) action potentials. (D) Left, a field of ~40 MLIs illuminated by DMD targeting. Right, after pre-processing and spike sorting, high-SNR recordings (2 kHz) of basal firing were obtained simultaneously from 26 MLIs from the field at left. (E) Individual (gray) and mean (black) autocorrelograms of all MLIs. Gaps around t = 0 (time of each spike) indicate refractory periods. (F) Left, mean normalized spike waveform of all MLIs. Right, histogram of spike width at half maximum of each cell. (G) Histogram of basal firing rates (black).
Figure 2.
Figure 2.. Sensorimotor responses of individual MLIs
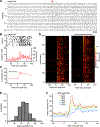
(A) Left, mouse silhouette imaged from above, showing C2 (red) and C1 whiskers and air puffer. Middle, the tracked position of C2 across 30 air puff presentations. Right, a corresponding recording from an ipsilaterally imaged MLI. Red arrows indicate when the air puff reached the whisker pad, i.e., the onset of the sensory stimulus, set to time 0 in all plots. (B) Heatmaps for each MLI (n = 222) of mean PSTHs to 100 puffs. (C) Top, mean puff-evoked whisker position ± SEM (undetectable). Bottom, mean PSTH of 2-ms spike probability associated with 100 applications of the sensory stimulus for all cells in (B). (D) As in (C) for spontaneous whisks aligned to the initiation of protraction. (E) Left, mean PSTH of 2-ms spike probability with spike times jittered with σ of ±0, 2, 4, 8, or 16 ms. Right, jitter-subtracted spike probability histograms. Legend is the same as that at left.
Figure 3.
Figure 3.. Sensory input synchronizes action potentials of molecular layer interneurons
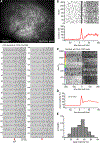
(A) Spikes recorded simultaneously in 20 MLIs before and after an air puff (arrow and dotted line). (B) Top, spike raster for each neuron in (A), and bottom, the coactivity trace (4-ms bins), showing a maximum of 15/20 synchronously firing neurons. (C) Mean coactivity across 12 FOVs, each with ≥10 neurons. (D) Trial-by-trial coactivity for a group of MLIs, with trials ordered consecutively (left) and sorted according to peak post-puff coactivity (right). (E) Probability distribution of post-puff peak coactivity (10% bins) from all groups and all trials, illustrating trial-to-trial variability. (F) Full-length traces of mean coactivity, from averaging traces in individual bins in (E), from all groups and all trials. Values listed in the legend indicate the low end of each bin.
Figure 4.
Figure 4.. Measurement of widespread sensory-evoked synchrony with pAce
(A) Top, DMD-targeted crus I MLIs expressing pAce. Bottom, a single trial of spikes recorded simultaneously in 318 MLIs imaged at 3,000 fps. Arrows, time of puff. Note the widespread sensory-evoked synchrony. (B) Top, single trial spike raster for the MLIs in (A) aligned to the air puff. Bottom, coactivity trace for the same trial. (C) Single-trial spike rasters for 2,370 MLIs across 15 FOVs. Each colored vertical bar denotes a different FOV. (D) Mean coactivity across all trials across 15 FOVs. (E) Probability distribution of post-puff peak coactivity (10% bins) from all groups and all trials, illustrating variability in peak coactivity.
Figure 5.
Figure 5.. Spike synchrony vs. spike rate dependence of coactivity
(A) Raw (left) vs. jittered (right) raster of spike times from a single FOV on a single trial in MLIs expressing pAce. (B) Raw coactivity (left), jittered (rate-based) coactivity (middle), and rate-corrected coactivity (synchrony) obtained by subtraction (right). Same FOV as in (A). (C) Top, mean coactivity (red) and jittered coactivity (black) traces ± SEM for all trials across all FOVs imaged with pAce. Bottom, rate-corrected synchrony trace (blue) obtained by subtraction of jittered from raw trace. (D) Peak raw coactivity vs. time-matched jittered coactivity for all trials, illustrating that coactivity peaks are reliably lost when synchrony is removed by jittering.
Figure 6.
Figure 6.. Correlation of trial-by-trial sensory-evoked synchrony with movement magnitude
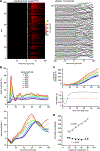
(A) Coactivity across 100 trials from an FOV expressing pAce (left) and tracked whisker position (right). (B) Top, coactivity traces averaged in 10% bins for all trials for the 15 FOVs recorded with simultaneous whisker imaging and voltage imaging of pAce. Bottom, mean traces of whisker movements associated with each level of coactivity. (C) Top, cumulative amplitude of whisker movements over time, from integrating traces in (B). Bottom, correlation between each time point of the cumulative amplitude traces and the fixed maximum coactivity for each 10% bin. (D) Cumulative amplitude vs. maximum coactivity at the times of minimum and maximum correlation, r, as labeled. Lines, linear fits from which correlations were obtained (gray).
Figure 7.
Figure 7.. Optogenetic perturbation of synchronous MLI-to-Purkinje cell inhibition
(A) Schematic illustrating experimental test of necessity of timed MLI inhibition in driving puff-evoked whisks. An MLI (black) innervates a ChR2-expressing Purkinje (Pkj) cell (blue). (B) Top, mean ± SEM puff-evoked change in whisker position for puff only (black) and puff with early photostimulation of Pkj cells (light blue). Bottom, same as (top), for late photostimulation. Late protractions in both blue traces result from pauses in Pkj cell firing and concomitant rebound firing in CbN cells following strong photostimulation. (C) Schematic illustrating experimental test of sufficiency of timed MLI inhibition in driving puff-evoked whisks. A ChR2-expressing MLI (blue) innervates a Pkj cell (black). (D) Puff-evoked change in whisker position for puff only (black) and puff with 5-ms photostimulation of MLIs (light blue) during the period of peak MLI coactivity. (E) Light-evoked change in whisker position with no puff (light blue) vs. catch trials without stimulation (black). (F) Heatmaps of whisker position from a single mouse for catch trials (top) and photostimulation trials sorted by pre-stimulus movement (bottom). (G) Mean light-evoked change in whisker position for trials in which the light stimulus was preceded by whiskers either at rest (dark blue) or moving (light blue). (H) Population puff-evoked PSTHs of MLIs (n = 2,370 imaged with pAce, red), superimposed on PSTHs replotted from Brown and Raman recorded electrophysiologically in Pkj cells (n = 51, blue) and CbN cells (n = 8, black). Bin width, 2 ms. The synchronous MLI response is initiated as Pkj cell simple spikes are suppressed, which is associated with a brief episode of increased firing in the CbN. In all plots, t = 0 ms is the time that the air puff stimulates the whisker pad. (I) A schematic of the convergent architecture of the MLI to Pkj cell to CbN cell network, based on estimates from Kim et al. and Person and Raman (2012), illustrating that many MLIs can regulate disinhibition of individual CbN neurons, thereby modulating motor output.

References

    1. Thach WT (1968). Discharge of Purkinje and cerebellar nuclear neurons during rapidly alternating arm movements in the monkey. J. Neurophysiol 31, 785–797. 10.1152/jn.1968.31.5.785. - DOI - PubMed
    1. Armstrong DM, and Edgley SA (1984). Discharges of Purkinje cells in the paravermal part of the cerebellar anterior lobe during locomotion in the cat. J. Physiol 352, 403–424. 10.1113/jphysiol.1984.sp015300. - DOI - PMC - PubMed
    1. Herzfeld DJ, Kojima Y, Soetedjo R, and Shadmehr R (2015). Encoding of action by the Purkinje cells of the cerebellum. Nature 526, 439–442. 10.1038/nature15693. - DOI - PMC - PubMed
    1. Chen S, Augustine GJ, and Chadderton P (2016). The cerebellum linearly encodes whisker position during voluntary movement. eLife 5, e10509. 10.7554/eLife.10509. - DOI - PMC - PubMed
    1. Brown ST, and Raman IM (2018). Sensorimotor integration and amplification of reflexive whisking by well-timed spiking in the cerebellar corticonuclear circuit. Neuron 99, 564–575.e2. 10.1016/j.neuron.2018.06.028. - DOI - PMC - PubMed

LinkOut - more resources