

SpaVGN: A hybrid deep learning framework for high-resolution spatial transcriptomics data reconstruction and spatial domain identification
- PMID: 40811380
- PMCID: PMC12352682
- DOI: 10.1371/journal.pone.0329122
SpaVGN: A hybrid deep learning framework for high-resolution spatial transcriptomics data reconstruction and spatial domain identification
Abstract
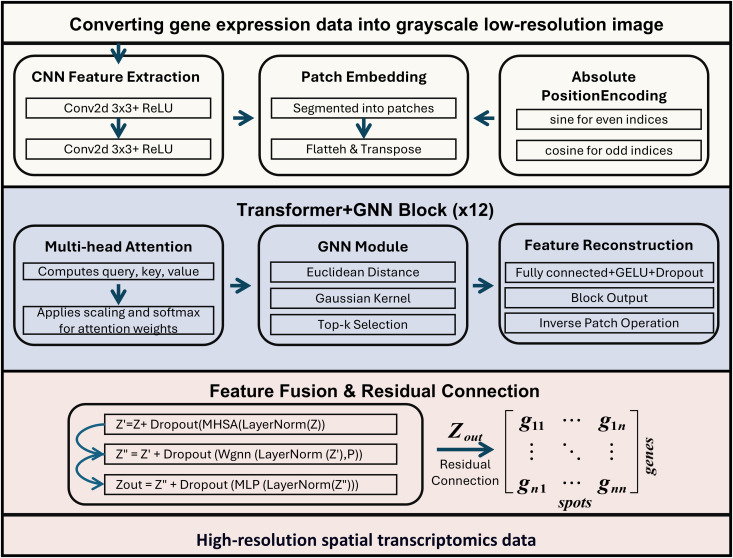
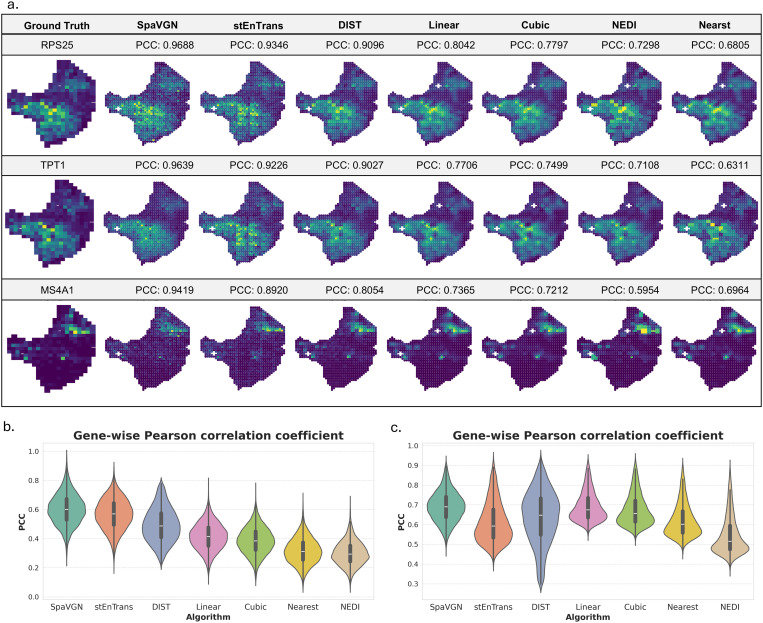
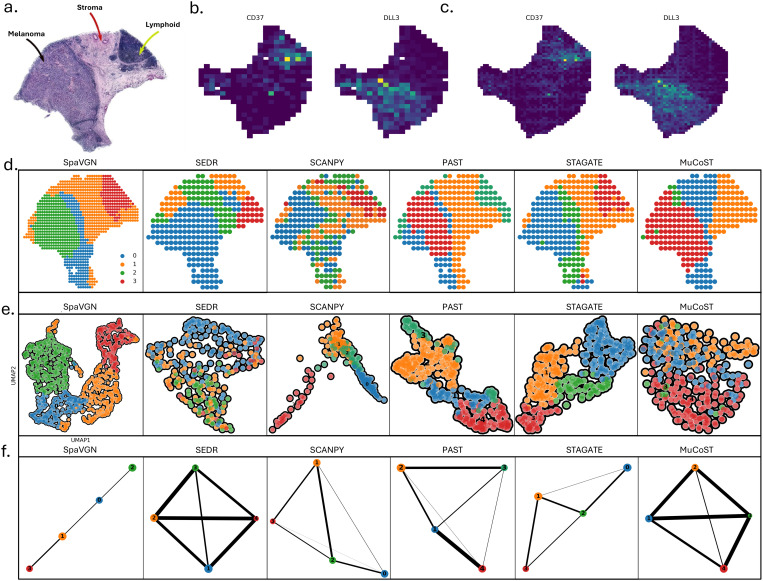
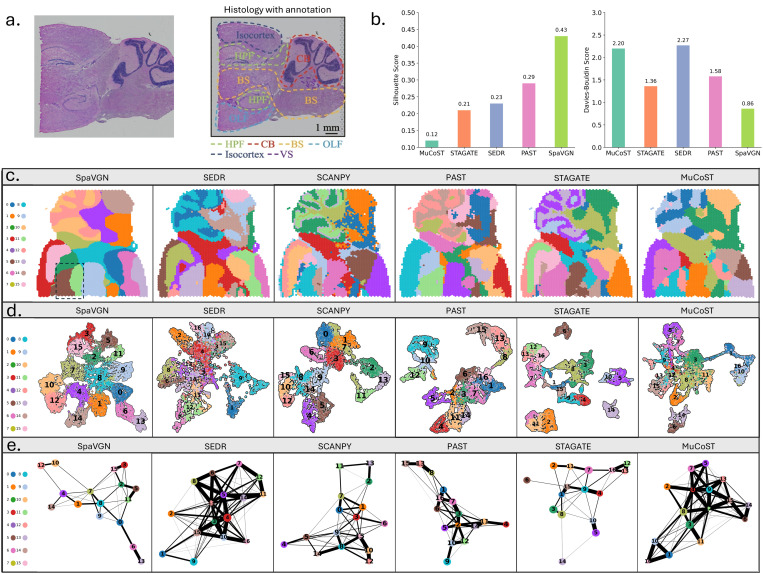
Spatial transcriptomics has revolutionized the analysis of gene expression while preserving tissue spatial information, which provides novel insights into the cellular composition and function of complex biological tissues. However, current technologies are constrained by limited resolution and data sparsity, compromising the accuracy of downstream analyses. To address these challenges, we developed SpaVGN, a deep learning framework integrating convolutional neural networks, vision transformer, and graph neural networks for high-fidelity gene expression imputation and spatial domain identification. By combining local feature extraction, global attention mechanisms, and spatial graph-based modeling, SpaVGN effectively reconstructs missing transcriptomic data while preserving spatial tissue architecture. Evaluated on melanoma and sagittal posterior mouse brain datasets, SpaVGN outperformed existing methods in gene expression prediction, achieving Pearson correlation coefficients of 0.609 (melanoma) and 0.682 (mouse brain). It clearly delineated tumor regions and lymphoid niches in melanoma tissue, achieving fine-grained resolution of hippocampal subfields, including Cornu Ammonis and Dentate Gyrus, with a Silhouette Score of 0.43 and a Davies-Bouldin Index of 0.86. Validation through UMAP dimensionality reduction and PAGA network analysis demonstrated that SpaVGN significantly mitigates the negative impact of data sparsity in spatial transcriptomics, improving data completeness and spatial continuity. This study presents an innovative solution that enhances the resolution of spatial transcriptomics data, offering cross-tissue applicability and providing a valuable tool for research in biological development, disease, and tumor heterogeneity.
Copyright: © 2025 Wang et al. This is an open access article distributed under the terms of the Creative Commons Attribution License, which permits unrestricted use, distribution, and reproduction in any medium, provided the original author and source are credited.
Conflict of interest statement
The authors have declared that no competing interests exist.
Figures
Similar articles
-
stGRL: spatial domain identification, denoising, and imputation algorithm for spatial transcriptome data based on multi-task graph contrastive representation learning.BMC Biol. 2025 Jul 1;23(1):177. doi: 10.1186/s12915-025-02290-z. BMC Biol. 2025. PMID: 40597202 Free PMC article.
-
stGNN: Spatially Informed Cell-Type Deconvolution Based on Deep Graph Learning and Statistical Modeling.Interdiscip Sci. 2025 Jun 26. doi: 10.1007/s12539-025-00728-0. Online ahead of print. Interdiscip Sci. 2025. PMID: 40571903
-
Short-Term Memory Impairment.2024 Jun 8. In: StatPearls [Internet]. Treasure Island (FL): StatPearls Publishing; 2025 Jan–. 2024 Jun 8. In: StatPearls [Internet]. Treasure Island (FL): StatPearls Publishing; 2025 Jan–. PMID: 31424720 Free Books & Documents.
-
Comparison of self-administered survey questionnaire responses collected using mobile apps versus other methods.Cochrane Database Syst Rev. 2015 Jul 27;2015(7):MR000042. doi: 10.1002/14651858.MR000042.pub2. Cochrane Database Syst Rev. 2015. PMID: 26212714 Free PMC article.
-
Systemic pharmacological treatments for chronic plaque psoriasis: a network meta-analysis.Cochrane Database Syst Rev. 2021 Apr 19;4(4):CD011535. doi: 10.1002/14651858.CD011535.pub4. Cochrane Database Syst Rev. 2021. Update in: Cochrane Database Syst Rev. 2022 May 23;5:CD011535. doi: 10.1002/14651858.CD011535.pub5. PMID: 33871055 Free PMC article. Updated.
References
LinkOut - more resources
Full Text Sources
Miscellaneous
