. 2025 Aug 26;122(34):e2507208122.
doi: 10.1073/pnas.2507208122. Epub 2025 Aug 14.

A tubulin-MAPKKK pathway engages tubulin isotype interaction for neuroprotection

Affiliations

A tubulin-MAPKKK pathway engages tubulin isotype interaction for neuroprotection

Junxiang Zhou et al. Proc Natl Acad Sci U S A. .

Abstract

The microtubule (MT) cytoskeleton is essential for neuronal morphology, neurite growth, synapse formation and maintenance, as well as regulation of signal transduction. Most cells express multiple isotypes of α- and β-tubulin that can coassemble into MTs. While a variety of signaling pathways regulate MT integrity and homeostasis, little is known about how tubulin isotypes interact in vivo. Here, we report a mechanism in which altered function of a neuronal β-tubulin in Caenorhabditis elegans activates the conserved kinase DLK-1 and its downstream signal transduction, which in turn upregulates expression of an α-tubulin isotype to ensure MT integrity. We find that alteration in the T7 loop of the β-tubulin/BEN-1 causes the formation of BEN-1-enriched islands along MTs in neurites. Combining genome editing with cellular imaging, we identified amino acid residues in α-tubulin/TBA-2 that are necessary for formation of BEN-1 islands. Activation of DLK-1 signaling in ben-1 mutants promotes TBA-2 transcription and protects axon and synapse morphology. These data uncover a positive feedback loop between DLK-1 and regulation of tubulin isotype interaction that maintains neuronal resilience.

Keywords: DLK kinase; bZip protein CEBP-1; microtubule plasticity; neuronal resilience; tubulin isotype.


Conflict of interest statement

Competing interests statement:The authors declare no competing interest.

Figures

Fig. 1.
Fig. 1.
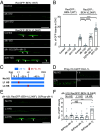
ben-1(L246F) elevates DLK-1 signaling. (A) 3D structural model of α/β-tubulin heterodimer based on the structure of bovine brain tubulins (PDB accession code: 1TUB) (35). PDB DOI: https://doi.org/10.2210/pdb1TUB/pdb. GDP is bound to β-tubulin, GTP to α-tubulin; color highlights T7 loop (yellow), Leu246 (red), H7 α-helix (brown), and Thr238 (orange). (B) Compound fluorescence microscope images of CEBP-1::EGFP (wgIs563) in the ventral nerve cord (VNC) in L4-stage animals of indicated genotypes and treatment. Blue arrows mark neuronal nuclei showing visually detectable increased CEBP-1::EGFP, compared to WT animals. (Scale bar, 20 μm.) Null (0) alleles: ben-1(ju1813), dlk-1(tm4024). (C) Quantification of neuronal nuclei with increased CEBP-1::EGFP. n = 15 animals. Kruskal–Wallis test and Dunn’s posttest; **P ≤ 0.01, ***P ≤ 0.001, ****P ≤ 0.0001. (D) Bright field images of animals of genotypes indicated cultured on control plates or plates containing 7 μM benomyl for 3 d. (Scale bar, 1 mm.) (E) Quantification of paralysis in animals of indicated genotypes cultured on plates containing benomyl of indicated concentration. 100 animals were scored per genotype/condition, from three experiments.
Fig. 2.
Fig. 2.
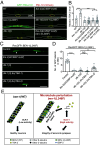
BEN-1(L246F) displays enrichment within stable MTs. (A) Kymographs of EBP-2::GFP in the ventral neurites of D-type GABAergic motor neurons in day 1 adults (D1A). Red line indicates a single EBP-2::GFP track. (BD) Quantification of number (B), run length (C), and velocity (D) of EBP-2::GFP tracks in WT and ben-1(L246F) animals. n = number of animals in (B) and number of EBP-2::GFP tracks in (C and D). t test; NS (not significant), *P ≤ 0.05. (E) Schematics of Split GFP labeling of BEN-1(WT) and BEN-1(L246F) with representative confocal images of the DNC shown below. GFP11::BEN-1 (KI, ju1855) and GFP11::BEN-1(L246F) (KI, ju1959) are reconstituted with pan-neuronal expressed Prgef-1-GFP1-10 (juIs409) to generate RecGFP::BEN-1(WT) and RecGFP::BEN-1(L246F), respectively. Arrows indicate RecGFP::BEN-1(L246F) islands. (Scale bar, 10 μm.) (F) Quantification of RecGFP islands in DNC of animals at indicated stages. n = 18 animals. Kruskal–Wallis test and Dunn’s posttest; ****P ≤ 0.0001. (G and H) Quantification of the length (G) and intensity (H) of RecGFP::BEN-1(L246F) islands in animals at indicated stages. Relative intensity was calculated by dividing the intensity by the average intensity of RecGFP::BEN-1(WT). n = 96 islands. t test; NS (not significant), ****P ≤ 0.0001. (I) Quantification of RecGFP islands in DNC of animals cultured on plates containing 4 μM nocodazole (+) or buffer (−) for 2 d. n = 14 animals. Kruskal–Wallis test and Dunn’s posttest; ****P ≤ 0.0001. (J and K) Time-lapse confocal imaging of RecGFP::BEN-1(L246F) islands in commissures of D1A. (J) shows the formation of an island: The white arrowhead indicates the site of island formation, white arrows the island, yellow arrows the direction of island extension. (K) shows the dynamics of an island after it reached a steady length. (Scale bar, 5 μm.)
Fig. 3.
Fig. 3.
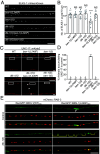
BEN-1(L246F) islands within MT shafts are enriched for GTP tubulin-binding protein. (AF) Confocal images (Top) and line scan (Bottom) of Prgef-1-mKate2::MAPH-1.1 with RecGFP::BEN-1(WT) (A) and RecGFP::BEN-1(L246F) (B) in DNC, Prgef-1-PTRN-1::Crimson with RecGFP::BEN-1(WT) (C) and RecGFP::BEN-1(L246F) (D) in commissures, Prgef-1-EBP-2::mKate2 with RecGFP::BEN-1(WT) (E) and RecGFP::BEN-1(L246F) (F) in commissures of D2A. Dashed lines denote regions used for line scan analysis. (Scale bar, 10 μm.) (G) Percentage of RecGFP::BEN-1(L246F) islands coenriched for the indicated protein in D2A. n = number of islands. Quantification was performed on images of neurites coexpressing RecGFP::BEN-1(L246F) and the indicated protein.
Fig. 4.
Fig. 4.
TBA-2 pairs with BEN-1(L246F) to form MT islands, dependent on specific residues. (A and B) Confocal images (Top) and line scan (Bottom) of RecGFP::BEN-1(L246F) with Prgef-1-mKate2::TBA-1 (A) and Prgef-1-mKate2::TBA-2 (B) in DNC of D2A. Dashed lines denote regions used for line scan analysis. (C) Percentage of RecGFP::BEN-1(L246F) islands coenriched for mKate2-tagged tubulin isotypes in D2A. n = number of islands. Quantification was performed on images of neurites coexpressing RecGFP::BEN-1(L246F) and the indicated tubulin isotype. (D and E) Confocal images (D) and island quantification (E) of RecGFP::BEN-1(L246F) in DNC of animals of indicated genotypes. Ex(TBA-2), Prgef-1-TBA-2. Arrows indicate RecGFP::BEN-1(L246F) islands. (Scale bar in A, B, and D, 10 μm.) n = 18-23 animals. One-way ANOVA and Tukey’s posttest; NS (not significant), ****P ≤ 0.0001. (F and G) Models of BEN-1(L246F)/TBA-1 (confidence scores: pLDDT = 90.9 pTM = 0.905 ipTM = 0.909) and BEN-1(L246F)/TBA-2 (confidence scores: pLDDT = 89.9 pTM = 0.906 ipTM = 0.904) heterodimers using ColabFold. (H) Quantification of RecGFP::BEN-1(L246F) islands in DNC. n = 20 animals. One-way ANOVA and Tukey’s posttest; NS (not significant), ****P ≤ 0.0001. (I) Bright field images of animals of indicated genotypes on NGM plates. (Scale bar, 1 mm.) tba-2(ΔC/EBP motif), tba-2(ju2008). Null (0) allele: tba-1(ok1135), tba-2(tm6948).
Fig. 5.
Fig. 5.
DLK-1 promotes BEN-1(L246F) island formation in mature neurons. (A and B) Confocal images (A) and island quantification (B) of RecGFP::BEN-1(WT) and RecGFP::BEN-1(L246F) in DNC of animals of indicated genotypes. Arrows indicate RecGFP::BEN-1(L246F) islands. Null (0) alleles: dlk-1(tm4024), rpm-1(ju44). Si(Pn-dlk-1), Prgef-1-GFP::DLK-1L (juSi163). n = 20-29 animals. One-way ANOVA and Tukey’s posttest; ****P ≤ 0.0001. (C) Schematic of the HS assay. (D) Confocal images of Phsp-16.2-GFP::DLK-1L [juSi277, Si(Phsp-dlk-1)] in VNC of L4-stage animals with no HS or at the indicated time after HS. (E and F) Confocal images (E) and island quantification (F) of RecGFP::BEN-1(L246F) in VNC of animals of indicated genotypes and treatment. Arrows indicate RecGFP::BEN-1(L246F) islands. n = 9-20 animals. t test; NS (not significant), ***P ≤ 0.001. (Scale bar in A, D, and E, 10 μm.)
Fig. 6.
Fig. 6.
DLK-1 promotes TBA-2 expression for BEN-1(L246F) island formation. (A) Confocal images of GFP::TBA-2 (KI, tj38) in VNC of day 2 adults of indicated genotypes. Dashed ovals mark GABAergic DD motor neurons labeled by Pflp-13::mCherry. dlk-1(0), dlk-1(tm4024); tba-2(ΔC/EBP motif), tba-2(ju2008). (Scale bar, 10 μm.) (B) Quantification of relative intensity of GFP::TBA-2 in the soma of VNC motor neurons in animals of indicated genotypes. n = 18-57 neurons. One-way ANOVA and Tukey’s posttest; ***P ≤ 0.001. (C and D) Confocal images (C) and island quantification (D) of RecGFP::BEN-1(L246F) in DNC of animals of indicated genotypes. Ex(TBA-1), Prgef-1-TBA-1; Ex(TBA-2), Prgef-1-TBA-2. Arrows indicate RecGFP::BEN-1(L246F) islands. (Scale bar, 10 μm.) n = 20-23 animals. Kruskal–Wallis test and Dunn’s posttest; NS (not significant), **P ≤ 0.01, ****P ≤ 0.0001. (E) Graphic illustration of DLK-1-mediated neuronal resilience to ben-1(L246F)-induced MT perturbation.
Fig. 7.
Fig. 7.
DLK-1 ensures synapse formation and axon morphology in ben-1(L246F) mutants. (A and B) Airyscan images (A) and quantification (B) of ELKS-1::mNG (KI, syb1710) in DNC of indicated genotypes. (Scale bar, 10 μm.) n = 13-14 animals. One-way ANOVA and Tukey’s posttest; NS (not significant), ****P ≤ 0.0001. (C) Airyscan images of UNC-17::mKate2 (KI, ot907) in D2A of indicated genotypes. Boxed DNC regions are shown enlarged. Arrowheads indicate commissures accumulating UNC-17::mKate2; dashed oval marks a neuronal soma accumulating UNC-17::mKate2. (Scale bar, 10 μm.) (D) Quantification of animals showing ectopic accumulation of UNC-17::mKate2 in the commissures (Commi). 60 animals were scored per genotype. n = 3 experiments. Kruskal–Wallis test and Dunn’s posttest; **P ≤ 0.01. (E) Confocal images of RecGFP::BEN-1(WT)DD (Left) or RecGFP::BEN-1(L246F)DD (Right) with Punc-25::mCherry::RAB-3 (juIs236) in DD neuron dorsal axons in adults of indicated genotypes. GFP1-10 is expressed in DD neurons using Pflp-13-GFP1-10 (juIs463). White arrows, RecGFP::BEN-1(L246F)DD islands; Yellow brackets, regions where RecGFP::BEN-1(L246F)DD is undetectable. (Scale bar, 10 μm.) Null (0) alleles are dlk-1(tm4024) and ben-1(ju1813).

References

    1. Kapitein L. C., Hoogenraad C. C., Building the neuronal microtubule cytoskeleton. Neuron 87, 492–506 (2015). - PubMed
    1. Cason S. E., Holzbaur E. L. F., Selective motor activation in organelle transport along axons. Nat. Rev. Mol. Cell Biol. 23, 699–714 (2022). - PubMed
    1. Kelliher M. T., Saunders H. A., Wildonger J., Microtubule control of functional architecture in neurons. Curr. Opin. Neurobiol. 57, 39–45 (2019). - PMC - PubMed
    1. Prokop A., Cytoskeletal organization of axons in vertebrates and invertebrates. J. Cell Biol. 219, e201912081 (2020). - PMC - PubMed
    1. Dumont E. L., Do C., Hess H., Molecular wear of microtubules propelled by surface-adhered kinesins. Nat. Nanotechnol. 10, 166–169 (2015). - PubMed

MeSH terms

LinkOut - more resources