. 2025 Aug 14;389(6761):eadp3971.
doi: 10.1126/science.adp3971. Epub 2025 Aug 14.

Platelets sequester extracellular DNA, capturing tumor-derived and free fetal DNA

Affiliations

Platelets sequester extracellular DNA, capturing tumor-derived and free fetal DNA

Lauren Murphy et al. Science. .

Abstract

Platelets are anucleate blood cells vital for hemostasis and immunity. During cell death and aberrant mitosis, nucleated cells release DNA, resulting in "cell-free" DNA in plasma (cfDNA). An excess of cfDNA is deleterious. Given their ability to internalize pathogen-derived nucleic acids, we hypothesized that platelets may also clear endogenous cfDNA. We found that, despite lacking a nucleus, platelets contained a repertoire of DNA fragments mapping across the nuclear genome. We detected fetal DNA in maternal platelets and cancer-derived DNA in platelets from patients with premalignant and cancerous lesions. As current liquid biopsy approaches utilize platelet-depleted plasma, important genetic information contained within platelets is being missed. This study establishes a physiological role for platelets that has not previously been highlighted, with broad translational relevance.


Conflict of interest statement

Competing interests:

BP, AJM, CGC, LM, and NS are listed as inventors on patent GB2203947.3 (CRUK Ref: CR/2021-069), submitted in 2022 by the University of Oxford, which covers the detection of disease-associated gene mutations in nucleic acids derived from purified platelets. BP, AJM, and LM are also inventors on patent P45651WO1 (GB2314848.9), filed in 2023 by the University of Oxford, relating to the recovery of cell-free nucleic acids from platelets. BP is a co-founder and major shareholder of Alethiomics, has received honoraria for speaking engagements and/or advisory work for Incyte, BMS, Constellation Therapeutics, GSK, Blueprint Medicines, Novartis and Alethiomics and received research funding from Incyte, Galecto and Alethiomics. AJM is a co-founder and shareholder of Alethiomics, has received honoraria/served on advisory boards for Alethiomics, Novartis, CTI, Gilead and Shire has received research funding from Alethiomics and Galecto. LM has consulted for Alethiomics. All other authors declare that they have no conflicts of interest.

Figures
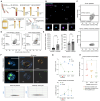
Fig. 1
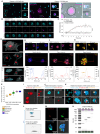
Fig. 1. Platelets sequester DNA during circulation.
(A) Schematic showing sources of purified platelets. Top, sequential centrifugation of peripheral blood to simultaneously extract DNA from a platelet pellet (pDNA) and platelet-depleted plasma (cfDNA); bottom left, centrifugation of healthy donor plateletpheresis concentrates to obtain a platelet pellet; bottom right, fluorescence-activated cell sorting of whole blood. (B) Healthy donor-derived platelets identified by CD42 AF488 (cyan) show an internal fluorescent signal for NUCLEAR-ID, a cell permeable dye that intercalates with double stranded DNA (magenta). White boxes show magnified regions, representative images shown, scale bars represent 2 μm. (C) Flow cytometric analysis of CD42+ healthy donor-derived platelets stained with and without the DNA marker DRAQ5. Top, 8% of circulating platelets stain strongly positive for DRAQ5, n = 20 healthy donors concatenated into a single FCS file. Bottom, single CD42+ stained platelets show no DRAQ5 autofluorescence, n = 10 healthy donors, concatenated data shown. (D) Flow cytometric analysis quantifying RNA content (SYTO-13 positivity) of CD42+, DRAQ5-hi and DRAQ5-lo/neg platelets (n = 10 healthy donors, concatenated data shown). (E) Platelets with a higher DNA content (DRAQ5-hi) showed higher levels of activation as determined by P-selectin (CD62P) and CD63 expression. Each dot represents an individual healthy donor. n = 19-20 donors for CD63 and CD62P, respectively. Bars show mean ± SD, ***P < 0.001; ****P < 0.0001; as determined by a Wilcoxon signed-rank test. (F) FISH and ddPCR showing detection of the Y-chromosome gene SRY in maternal platelets, but not leukocytes sampled from mothers of male offspring prior to delivery. Platelets and leukocytes were counterstained with β-tubulin (blue) and imaged using a ZEISS LSM900, 63X magnification. Representative images and ddPCR data shown, 3D rendering performed using ImarisViewer. n = 5 female donors (FISH) and n = 25 female donors (ddPCR). (G) Rise in cfDNA following acute depletion of platelets in healthy mice following administration of an anti-platelet antibody. n = 5 mice per day, n = 20 mice per condition. Each dot shows mean ± SEM fold change at Day 1, 3 and 5 compared to baseline (Day 0, untreated mice). (H) Plasma cfDNA concentrations (ng/ml) for patients with ITP and severely (< 20 x109/L, n = 7) or moderately (20 - 150 x109/L, n = 9) low platelet counts or counts in the normal range (> 150 x109/L, n = 7), *P < 0.05; for a Mann- Whitney U test, each point shows data from one individual, with line at the median. ddPCR, droplet digital PCR; FISH, fluorescence in situ hybridization; ITP, immune thrombocytopenic purpura; MFI, mean fluorescence intensity; SRY, sex-determining region Y.
Fig. 2
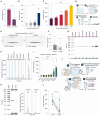
Fig. 2. Platelets rapidly internalize DNA released by nucleated cells via uptake of DNA-loaded extracellular vesicles (EVs) and non-membrane encapsulated DNA fragments.
(A) Healthy donor-derived, CD42 AF488 (cyan)-labeled platelets before (left) and after (middle and right) co-incubation with COLO205 cells labeled with NUCLEAR-ID (magenta) to track DNA transfer. White boxes show magnified regions; arrows highlight platelet uptake of COLO25-derived DNA and scale bars represent 2 μm. Middle (fluorescence) and far right (brightfield) are the same image. (B) Live-cell time-lapse imaging of a representative platelet showing internalization of DNA. Scale bars represent 3 μm. (C) Time-course quantification of platelet DNA fluorescence intensity, data points show mean ± SD. AF647 signal was measured in background regions to detect fluctuations. ****P < 0.0001; as determined by a Wilcoxon signed-rank test. Tracking shown for platelets incubated with control media (n = 168 platelets) or media conditioned by NUCLEAR-ID-labeled COLO205 cells (n = 173 platelets). (D-G) Representative images acquired using the Airyscan detector of a ZEISS LSM980 and 3D rendering performed using ImarisViewer. (D) Healthy donor platelets spread on collagen, stained with CD62P to create a translucent cell surface mask (turquoise) and DRAQ5 (DNA, red). Four representative platelets shown. Bottom panel shows alternate views of the same platelets from above and below, scale bars represent 2 μm. (E-G) Top, representative images and 3D renders of two healthy donor platelets showing co-localization of platelet DNA (DRAQ5, red) with (E) CD81 (vesicles, blue), (F) LAMP-2 (lysosomes, pink), and (G) TOM20 (mitochondria, yellow). Bottom, pixel intensity (y-axis) along defined lines (distance in μm, x-axis) was analyzed using ZEISS Zen software. (H) Manders’ correlation coefficients were calculated for DNA with mitochondria (TOM20), dense granules (CD63), alpha granules (CD62P), lysosomes (LAMP-2), and vesicles (CD81). Box plots show the median, Q1, and Q3, with whiskers extending to minimum and maximum values. Platelets analyzed per marker: TOM20 (n = 10), CD63 (n = 15), CD62P (n = 12), LAMP-2 (n = 15), and CD81 (n = 12). (I) A representative 3D reconstruction of EV clusters released by apoptotic BL2 cells labeled with an amine-reactive membrane dye (CF658, red) and DNA stain (DAPI, yellow), revealing internalized DNA. Imaged using a ZEISS LSM900, 63X magnification. Scale bars represent 2 μm. (J) Platelets stained with CD42 AF488 (cyan) following incubation with labeled EVs (red), showing three EVs within a single representative platelet. 3D modeling shows 90° clockwise rotation. Scale bar represents 1.4 μm. (K) 3D reconstruction showing platelet internalization of DNA-loaded apo-EVs (DNA: yellow, EVs: red). Two representative platelets are shown: one with surface-bound DNA-loaded EVs (top) and one with internalized EVs (bottom). Scale bars represent 0.5 μm unless stated otherwise. (L) ddPCR quantification of the Y-chromosome gene SRY in DNA derived from platelets of a female donor after incubation with apo-EVs and non-apo EVs. Representative data from n = 3 independent experiments. (M) Representative FISH and 3D render demonstrating fragments of X- and Y- chromosomes in female donor platelets following incubation with male HEL cells. Platelets counterstained with β-tubulin (blue). Imaged using a ZEISS LSM900, 63X magnification and 3D render created using ImarisViewer. (N) Electrophoresis data showing recovery of 128-657 bp synthetic DNA fragments from washed healthy donor platelets after overnight incubation. Representative data from n = 5 independent experiments. AIU, arbitrary intensity units; apo, apoptotic; BL2, Burkitt’s lymphoma cells; chr, chromosome; CCW, counterclockwise; CW, clockwise; EVs, extracellular vesicles; FISH, fluorescence in situ hybridization; POV, perspective of view; SE, succinimidyl ester; SRY, sex-determining region Y.
Fig. 3
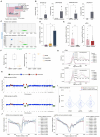
Fig. 3. Platelet DNA content can be pharmacologically modulated.
(A) Flow cytometric analysis of DNA (DRAQ5) content in healthy donor-derived platelets, with and without activation using 10 μM TRAP-6. n = 3, points represent data from individual healthy donors, bars show mean ± SD, **P < 0.01; as determined by a paired t test. (B, C) Inhibition of platelet activation with (B) aspirin or (C) ibrutinib increases the yield of DNA from platelet pellets. n = 3-4 independent experiments, plots show mean ± SD peak molarity corresponding to DNA TapeStation peaks for synthetic DNA fragments co-incubated with platelets prior to washing and DNA extraction. **P < 0.01; ****P < 0.0001; as determined by an unpaired t test. (D) Schematic of the method for investigating DNA uptake. Platelets were pre-treated with inhibitors, incubated with DNA-loaded apoptotic BL2-derived EVs (apo-EVs) or synthetic DNA fragments, then washed, pelleted, and subjected to DNA extraction. (E, F) ddPCR quantification of SRY in platelet-derived DNA from female donors after incubation of platelets with apo-EVs treated with or without Dynole. Fewer SRY copies were detected in dynamin-inhibited platelets compared to controls. (E) Representative ddPCR plot and (F) n = 5 independent experiments, paired line plot shows mean ± SD, with lines connecting data points before and after inhibition. (G, H) Representative electrophoresis showing recovery of 260 bp synthetic DNA fragments from platelets treated with inhibitors known to block components of cargo trafficking. More DNA was extracted from platelets treated with Dynole and amiloride. (I) Summary plot showing mean ± SD for all DNA fragment lengths (128-367 bp) following treatment with inhibitors (G, H). Data from four independent experiments (n = 4), with 2-5 replicate wells per condition. **P < 0.01; ***P < 0.001; as determined by a paired t test. (J) Schematic of the method for investigating platelet DNA release. Platelets were treated with or without Dynole, incubated with synthetic DNA, washed, resuspended in fresh buffer, and incubated for 3 hours. DNA was then extracted from platelet-depleted buffer. (K) Representative electrophoresis and (L) a paired-line plot showing significant inhibition of platelet DNA release following Dynole treatment, with lines connecting data points before and after inhibition. Data from five independent experiments (n = 5), with 2-3 replicate wells per condition. ****P < 0.0001; as determined by a paired t test. Apo, apoptotic; cyto D, cytochalasin D; ddPCR, droplet digital PCR; EVs, extracellular vesicles; FU, fluorescence units. SRY, sex-determining region Y.
Fig. 4
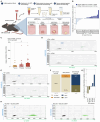
Fig. 4. Platelets contain a repertoire of DNA fragments that map over the human nuclear genome, including tumor-derived DNA bearing cancer-associated gene mutations.
(A) Schematic of the experimental system for co-incubating healthy donor platelets with malignant cells, separated by 1 μm membrane inserts to allow extracellular biomolecule and small EV exchange while preventing cell transfer. After co-incubation, platelets were removed, washed three times, and subjected to DNA extraction. (B) Number of copies of mutant alleles detected per µl of DNA extracted from platelets incubated with (+) or without (-) colorectal (LS180, COLO205 and HCT116) and erythroleukemia (HEL) cell lines. Data were collected from one to three independent experiments, with 3-5 replicate wells per condition. Each point represents one co-culture experiment per condition. Replicates per condition were as follows: LS180 (n = 2 experiments; 3 replicates each), COLO205 (n = 1 experiment; 4 and 5 replicates), HCT116 (n = 3 experiments; 3 replicates each), and HEL (n = 1 experiment; 3 and 4 replicates). Bars represent mean ± SD, *P < 0.05; as determined by a Wilcoxon paired signed rank test. (C) Representative ddPCR analysis showing quantification of wild-type BRAF and BRAFV600E alleles in pDNA extracted from healthy donor platelets before (top) and after co-incubation with COLO205 colorectal cancer cells (bottom). (D) Quantification of BRAFV600E in red blood cells, mononuclear cells and platelets following incubation in media conditioned by COLO205 cells. Data are presented as mean ± SD, n = 2, individual points represent independent experiments, each with 2 replicates. *P < 0.05; as determined by a Mann- Whitney U test. (E) Impact of DNase treatment on the detection of JAK2 mutant alleles in pDNA and cfDNA (media) following co-incubation of healthy donor platelets with HEL cells. Data are presented as mean ± SD, n = 5, points represent independent experiments, each with 3 replicates. n.s., not significant; **P < 0.01; determined by a Wilcoxon signed-rank test. (F) Percentage of fragments mapping to the nuclear and mitochondrial genomes from cell free DNA, short (> 100 and < 600 bp) and long (> 600 bp) platelet DNA fragments. In the box plot, the center line shows the median, whiskers indicate the minimum and maximum values, and each data point represents one patient, n = 15 donors with gastrointestinal carcinoma. (G) Fragment length distribution of paired, aligned reads for cfDNA (top) and s-pDNA (bottom). n = 6 donors with gastrointestinal carcinoma, samples 1-5 show a primary peak at ~165 bp (mono-nucleosomal) and a smaller secondary peak at ~325 bp (di-nucleosomal, inset). Sample 6 (red line), from a patient with untreated pancreatic adenocarcinoma, has shorter mono- and di-nucleosomal fragments than samples 1-5 (post anti-cancer therapy patients). (H) Deviation from median coverage in 100 kbp windows across all chromosomes for cfDNA (top) and s-pDNA (bottom) for P/008 (sample 6), revealing chromosomal aberrations in chromosomes 2, 6 and 7 (copy number gains and amplifications shown in red, deletions in green). (I) Detection rates of mutations in cfDNA, s-pDNA and l-pDNA for sample 7 where matched tumor biopsy was available. The red dot indicates mutations detected in the tumor biopsy; blue dots indicate 100 random samples of mutations from other patients with colorectal carcinoma from The Cancer Genome Atlas dataset. (J) Read depth distribution around transcription start sites of genes highly (TPM >15, blue) and lowly (TPM <15, green) expressed in peripheral blood mononuclear cells for cfDNA (left) and s-pDNA (right) mononucleosome reads. n = 6 donors with gastrointestinal carcinoma, depth per position per sample was normalized to the median read depth across all genes in that expression category. MNC, mononuclear cells; PLTs, platelets; RBC, red blood cells; TCGA, The Cancer Genome Atlas; TPM, transcripts per million; TSS, transcriptional start site; WT, wild type.
Fig. 5
Fig. 5. Detection of driver mutations in pDNA and cfDNA from mice with localized and metastatic colorectal adenocarcinoma, and patients with pre-malignant colonic lesions.
(A) Schematic showing isolation of platelet DNA (pDNA) and cell free (cfDNA) from C57BL/6 mice expressing KRASG12D and TP53 (KP) mutations via the villin promotor resulting in locally invasive colorectal adenocarcinoma, and mice with KRASG12D, TP53 and NOTCH (KPN) mutations with aggressive, metastatic disease. (B) Waterfall plot showing fold difference in copies of KRASG12D detected using ddPCR per μl of DNA extracted from the plasma (cfDNA) and platelets (pDNA) of KP and KPN mice, two weeks after tumor cell implantation, n = 5 KP and 15 KPN mice. (C) KRASG12D copies detected by ddPCR, shown as copies per µl of DNA extracted from plasma (cfDNA) and platelets (pDNA) of KP, KPN (circle), and KPC (square) mice, compared to the total number of copies from plasma and platelets. n = 5 KP, 15 KPN and 6 KPC, datapoints correspond to individual mice, mean ± SEM; **P < 0.01; as determined by a paired t test. (D, E) Representative ddPCR plots showing KRASG12D (blue) in higher abundance in pDNA (top) than in cfDNA (bottom) in two representative mice, (D) a KPN mouse and (E) a KP mouse. (F) Pie charts showing BRAFV600E detection in high-risk colonic lesion patients (SSL, n = 31) and colonoscopy-screened controls (n = 14). Mutant BRAF (>3 positive events) was found in 16.1% (5/31) of SSL patients and 0% (0/14) of controls. (G) Relative BRAFV600E copy number in pDNA vs. cfDNA for five SSL patients with detectable mutant BRAF. Data are log2-transformed with a pseudo count of 1. (H) ddPCR plot showing BRAFV600E (blue) in pDNA (left) and cfDNA (right) for two representative SSL patients. Data are combined. cfDNA, cell free DNA; CRC, colorectal cancer; ddPCR, droplet digital PCR; pDNA, platelet DNA; SSL, sessile serrated lesions; WT, wild type.

Comment in

  • The ins and outs of circulating DNA.
    Tsui WHA, Lo YMD. Tsui WHA, et al. Science. 2025 Aug 14;389(6761):683-684. doi: 10.1126/science.aea0555. Epub 2025 Aug 14. Science. 2025. PMID: 40811562

References

    1. Deppermann C, Kubes P. Start a fire, kill the bug: The role of platelets in inflammation and infection. Innate Immun. 2018;24:335–348. doi: 10.1177/1753425918789255. - DOI - PMC - PubMed
    1. Thon JN, et al. T granules in human platelets function in TLR9 organization and signaling. J Cell Biol. 2012;198:561–574. doi: 10.1083/jcb.201111136. - DOI - PMC - PubMed
    1. Koupenova M, et al. The role of platelets in mediating a response to human influenza infection. Nat Commun. 2019;10:1780. doi: 10.1038/s41467-019-09607-x. - DOI - PMC - PubMed
    1. Koupenova M, Freedman JE. Platelets and Immunity: Going Viral. Arterioscler Thromb Vasc Biol. 2020;40:1605–1607. doi: 10.1161/ATVBAHA.120.314620. - DOI - PMC - PubMed
    1. Koupenova M, et al. Pollen-derived RNAs Are Found in the Human Circulation. iScience. 2019;19:916–926. doi: 10.1016/j.isci.2019.08.035. - DOI - PMC - PubMed